

Typhoon Bavi hit eastern China. Then it became a tropical storm. Forecasters warned of days of heavy rain across eastern and northern China. None of this affects your portfolio.
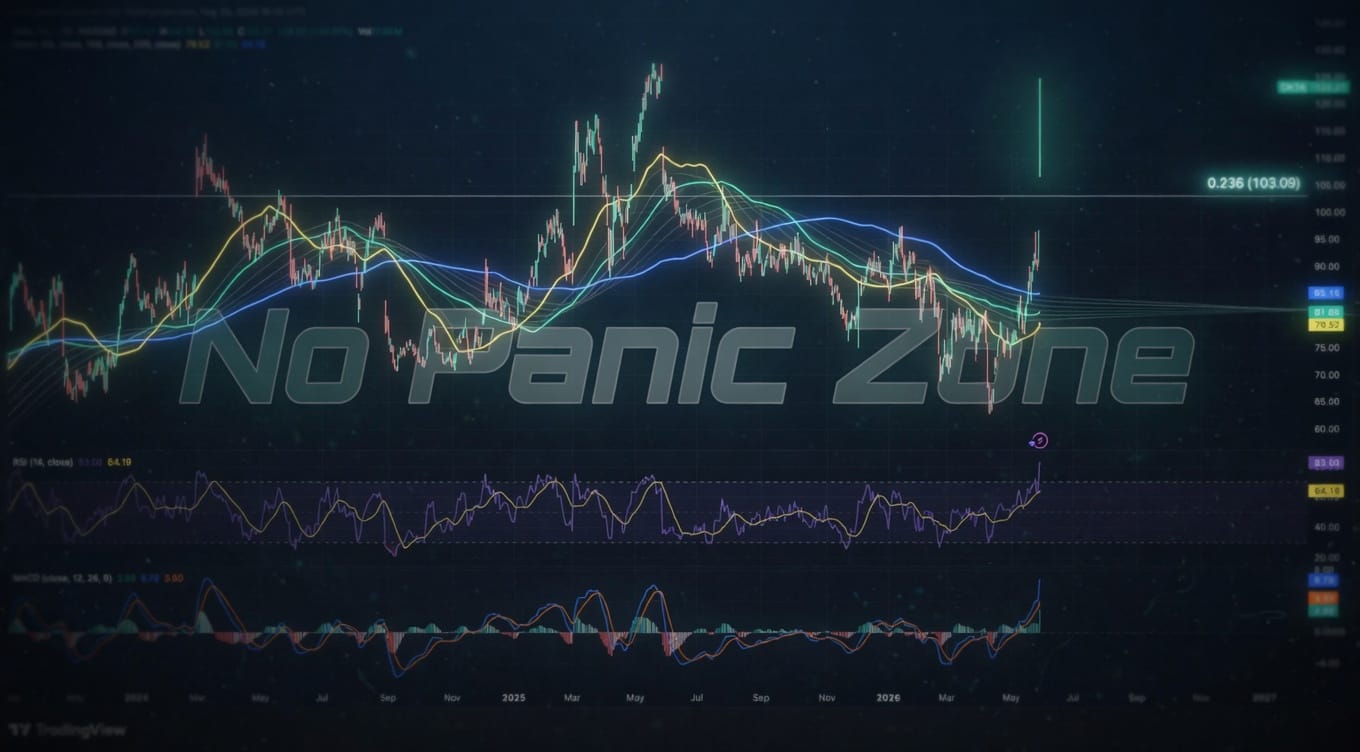
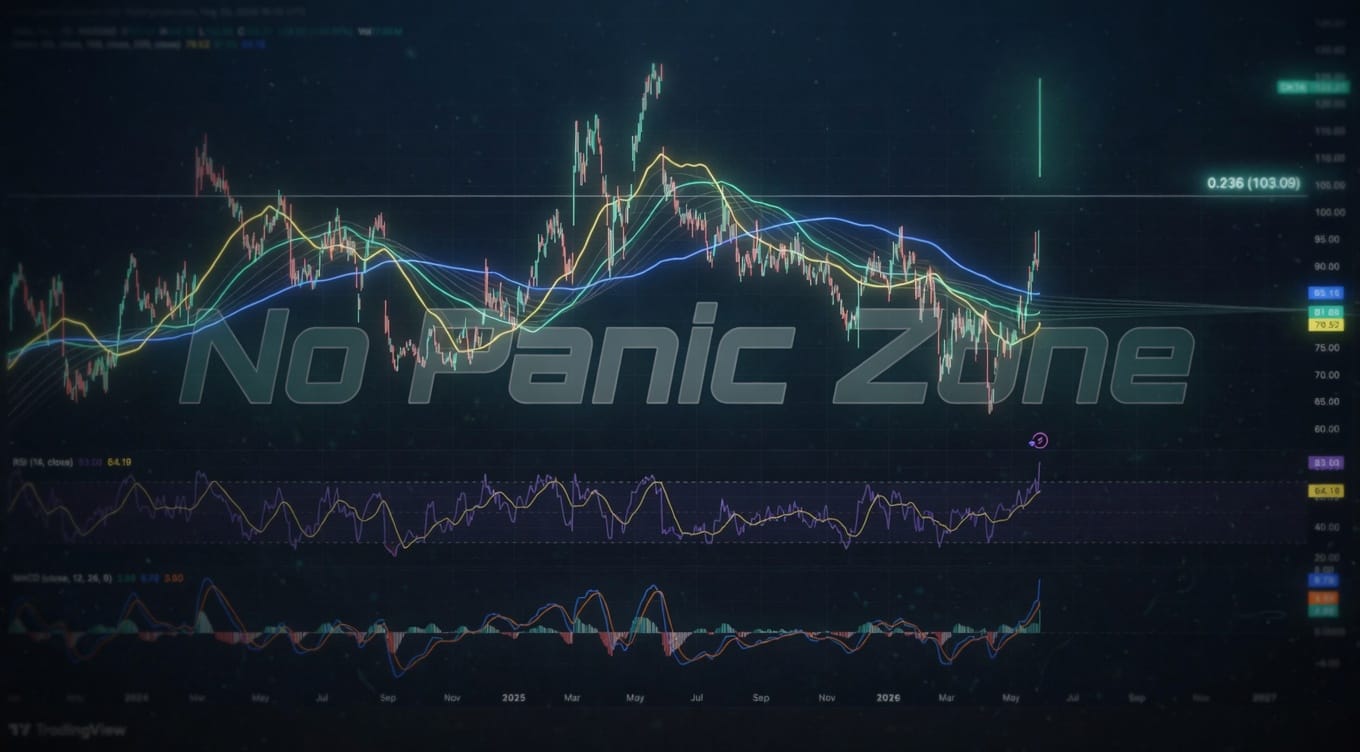
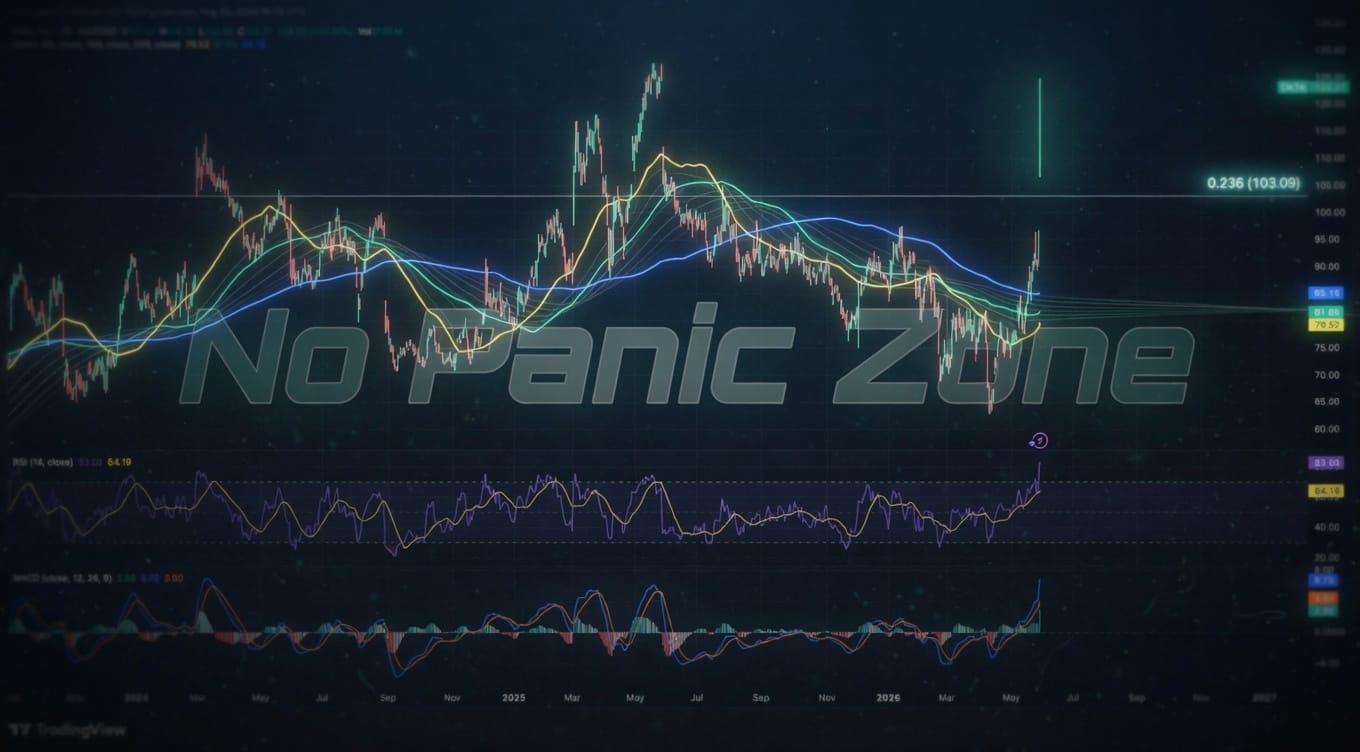
But someone right now is pulling up a chart. They're drawing lines on the Shanghai Composite. They're convinced this storm creates an opportunity. They're typing "typhoon stocks" into Google. They're about to learn that meteorology and technical analysis have something in common: both involve looking at patterns that don't predict the future, except one of them admits it.
The rain will fall. Supply chains might slow for a week. Insurance companies will pay claims. Construction firms will rebuild whatever needs rebuilding. China will continue being China. Your moving averages will continue being lines you drew on a screen because you saw someone do it on YouTube.
Somewhere a retail trader is calculating the correlation between typhoon intensity and copper futures. He's built a spreadsheet. He's color-coded it. He's named it "Weather Edge Strategy v3." He lost money on versions one and two but this time he's accounted for barometric pressure. This time is different.
The system could unleash widespread rain, according to forecasters who study actual data and use actual models. Not the kind of models where you backtest until the line goes up. The kind where you measure atmospheric conditions and apply physics. Revolutionary concept.
Bavi weakened but the delusion stays strong. The charts don't care about precipitation. The support levels don't move because it's raining in Zhejiang. The Fibonacci retracements weren't drawn by someone who checked the weather forecast.
The storm will pass. The rain will stop. The traders will still be broke, still convinced the next weather event is their edge, still typing "natural disaster trading strategy" into search bars at 2 AM, still wondering why the market doesn't respect their hard work monitoring typhoons instead of getting a job with health insurance.
Photo by Bornil Amin on Unsplash



Leave a Comment