
THS Trend Candles System | Weekly | August 19, 2026
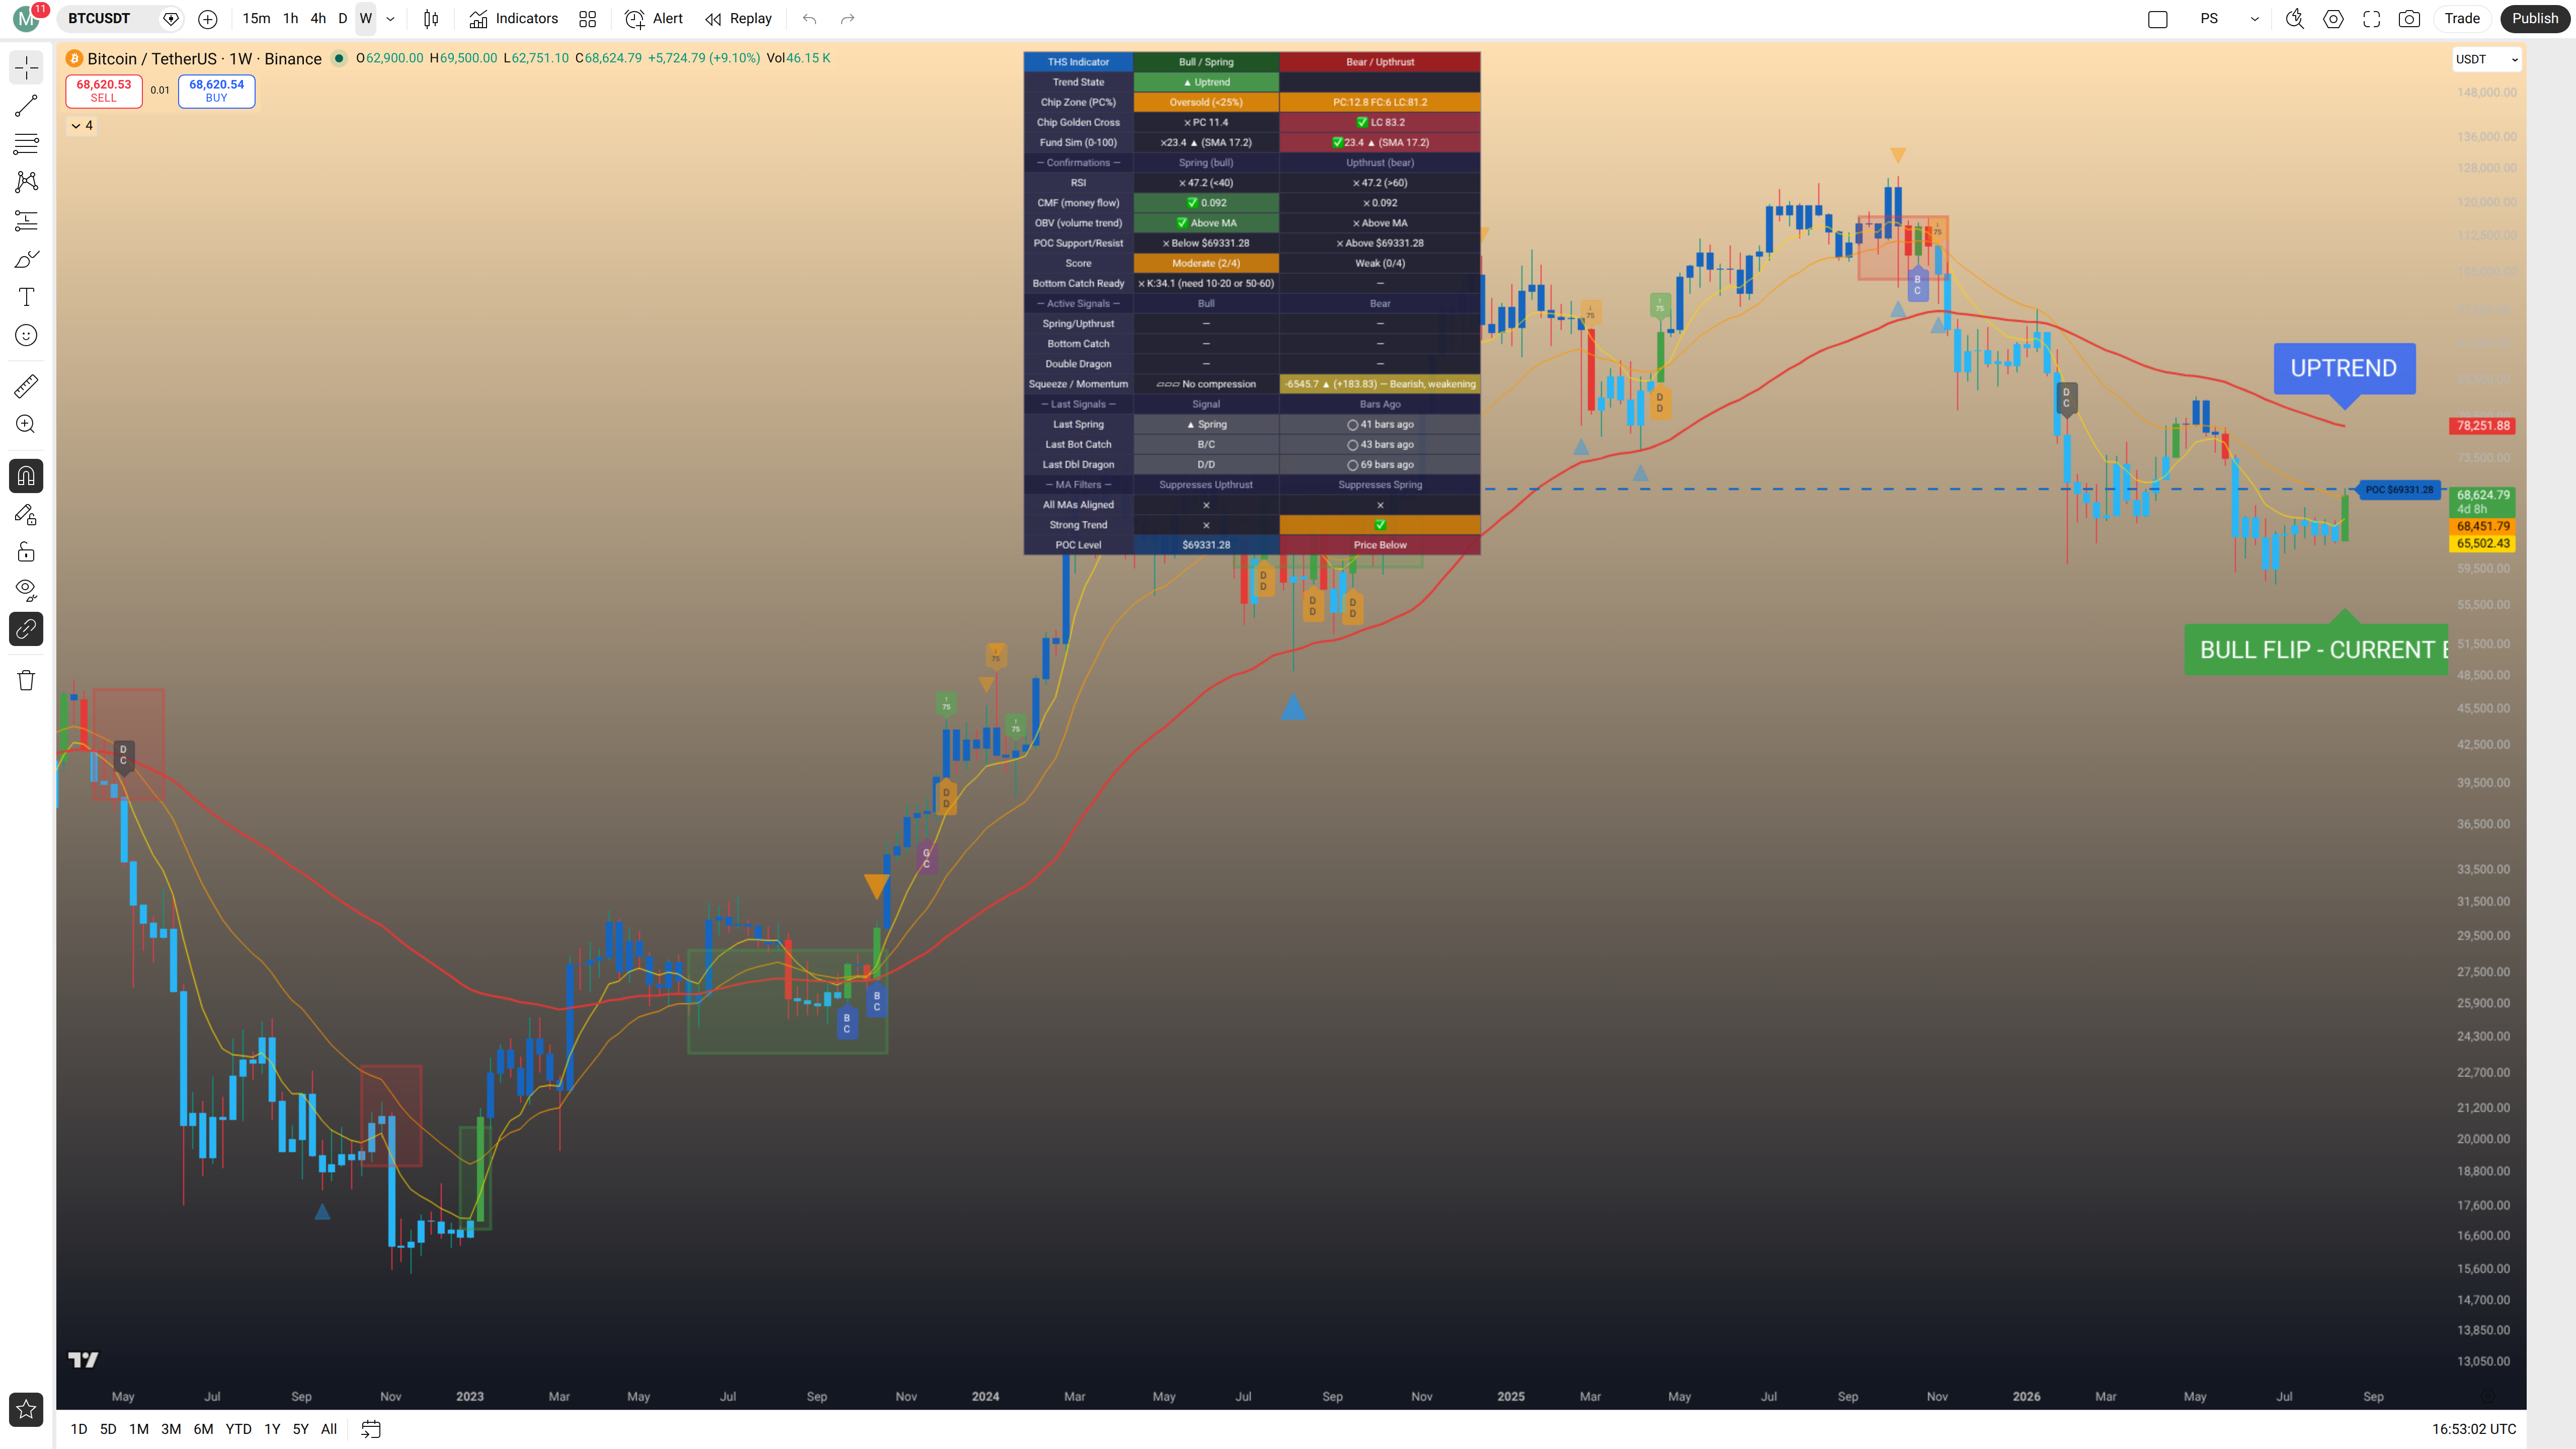
Don't worry about squinting at the small dashboard in the chart image above — every reading from it is broken out clearly in the summary table below.
Snapshot & Big Picture
Bitcoin (BTCUSDT) is the world's largest cryptocurrency by market capitalization, functioning as a decentralized digital store of value and medium of exchange with no central issuer or governing body.
After spending the better part of the past several months grinding through a confirmed weekly downtrend — with price pressured below its prior all-time high range and the dashboard registering a weak confirmation score throughout — Bitcoin has now printed what looks like a significant structural turn this week.
The governing signal is a Bull Flip — fired this bar: the current weekly candle is showing green, marking the first bar of a potential new uptrend, though this reading is provisional until the weekly close confirms it. This is a fresh flip on the Weekly chart — worth checking the Monthly timeframe too before treating this as the real trend.
This week Bitcoin has opened at $62,900.00, reached a high so far of $69,500.00, with a low of $62,751.10, and is currently trading at $68,624.79 — up approximately 9.1% on the week as of this writing, with the weekly candle still actively forming.
This candle is provisional and has not closed yet — the candle's color, the flip determination, and all OHLC values could still change before the weekly close.
Bitcoin was last covered here on July 30, 2026, when the chart was in a confirmed Downtrend with the POC sitting at $65,669.55 — the analysis called for waiting on a confirmed weekly bull flip candle closing above that POC level before considering any entries.
| Factor | Reading | Signal |
|---|---|---|
| Prior Coverage | July 30, 2026 — Downtrend, POC $65,669.55 | |
| Trend State | Bull Flip — fired this bar (provisional) | |
| Chip Zone (PC/FC/LC) | Oversold (<25%) — PC: 12.8 / FC: 6 / LC: 81.2 | |
| Golden Cross | LC 83.2 — long-chips SMA dominates; no Golden Cross yet | |
| Fund Sim (0–100) | 23.4 ▲, above its SMA of 17.2 | |
| RSI | 47.2 — below the 40 threshold for Spring confirmation; above 60 threshold for Upthrust | |
| CMF | 0.092 — above the 0.05 Spring threshold; below 0.10 genuine accumulation threshold | |
| OBV | Above MA — volume trend supporting the bullish move | |
| POC Support/Resist | $69,331.28 — price currently below POC | |
| Bull / Bear Score | Moderate (2/4 Bull) — Weak (0/4 Bear) | |
| Bottom Catch Ready | K: 34.1 — needs 10–20 or 50–60; not in zone | |
| MA Filters | All MAs Aligned: neither Bull nor Bear — Strong Trend: Bull ✅ | |
| Squeeze / Momentum | No compression — Momentum: −6,544.98 ▲ (+184.55), Bearish, weakening (converging toward zero) |
Overall: Bitcoin is currently printing a provisional weekly Bull Flip — the first green candle in what has been an extended downtrend — with price surging roughly 9% this week and reclaiming levels not seen since before the July pullback. The key risk right now is twofold: price has not yet closed above the critical POC at $69,331.28 (it sits just below it at the time of writing), and the chip distribution remains heavily dominated by Locked Chips, meaning most participants are still underwater and could provide meaningful overhead supply as price pushes higher. This is a developing situation worth watching closely for a confirmed weekly close, but it is not yet an entry signal — the prior July 30 analysis called for exactly a confirmed weekly bull flip candle closing above the POC, and while the flip is firing, that POC close condition has not yet been met. This is a fresh flip on the Weekly chart — worth checking the Monthly timeframe too before treating this as the real trend.
What the Chips Are Telling Us
- PC (Profitable Chips): 12.8% — only about one in eight participants in the price-volume distribution is currently sitting in profit at current levels. This is a deeply oversold chip picture.
- FC (Float Chips): 6% — a slim slice of the distribution is actively trading near the current price, suggesting relatively thin liquid supply immediately around current levels — which can allow price to move more freely in either direction once momentum asserts itself.
- LC (Locked Chips): 81.2% — the overwhelming majority of volume-weighted positions in this distribution are still underwater. These holders represent significant potential overhead resistance on any sustained rally, as they are likely to sell into strength to recover losses.
The chip zone is flagged as Oversold (PC below 25%), which historically tends to characterize conditions at or near longer-term bottoms — the setup where springs and accumulation sequences often emerge. That framing is consistent with what the Last Signals section will show: a Spring signal printed approximately 41 weeks ago, followed by a series of structural accumulation signals. The bullish interpretation here is that the deep Oversold chip state, combined with a fresh Bull Flip, points to potential long-term value at these levels. The bearish risk is that 81.2% in Locked Chips is a very large overhead supply overhang — every percent of price recovery invites more sell pressure from those trying to break even.
The Golden Cross check comes back clearly negative: the LC SMA at 83.2 vastly dominates the PC SMA at 11.4. For reference, at the prior coverage on July 30 the LC SMA was 80.8 with the PC SMA at 14.4 — the distribution has actually worsened slightly on the LC side since that post, meaning even more of the distribution has shifted into the underwater category over the past few weeks. A true Golden Cross (PC SMA crossing above LC SMA) remains a long way off, and until that cross occurs, the chip picture structurally favors patient, scaling accumulation over aggressive positioning.
Fund Simulation
Early Recovery Signal — Institutional Demand Beginning to Re-engage
The Fund Simulation is currently reading 23.4 and is trending upward (▲), sitting above its own SMA of 17.2. This is meaningful: when Fund Sim crosses above its SMA, it typically indicates that simulated institutional demand is re-accelerating — money flow patterns are beginning to shift toward accumulation rather than distribution. At 23.4 the absolute reading is still low (the scale runs 0–100), indicating the market is still in early recovery territory rather than a fully re-energized bull market regime, but the cross above the SMA is the directional signal that matters most here.
Compared to the prior coverage on July 30, 2026, where Fund Sim was at 16.5 and above its SMA of 13.8, the reading has climbed from 16.5 to 23.4 — a meaningful step upward. Both prior and current readings show Fund Sim above its own SMA, which suggests the re-engagement signal was already tentatively active at the last post and has since gained further ground. The pace of the climb from 16.5 to 23.4 over roughly three weeks is consistent with a genuine upside shift rather than a momentary blip, though the absolute reading remains modest and below the levels typically associated with a sustained bull trend.
Confirmations
Moderate Bull Confirmation (2/4) — Bearish Conditions Essentially Zero
RSI: The RSI is currently at 47.2. For the Spring (Bull) confirmation, the system needs RSI below 40 — it does not meet that threshold. For the Upthrust (Bear) confirmation, the system needs RSI above 60 — it does not meet that threshold either. At 47.2, RSI sits in mid-range, which is neither a confirming nor a disconfirming signal for the current bull move. RSI climbed from 40 at the prior July 30 post, which is consistent with this week's strong upward price action, though it still has room to develop further before entering a clearly overbought range.
CMF (Chaikin Money Flow): CMF is currently reading 0.092. This is above the 0.05 threshold required for Spring confirmation — that box is checked, and it is one of the two confirmed bullish confirmations contributing to the 2/4 score. However, it falls just short of the 0.10 threshold that would signal genuine, sustained accumulation. At 0.092 the money flow picture is constructive — real buying pressure is present — but it has not yet crossed into the territory where this indicator gives a high-conviction accumulation read. Worth watching whether this climbs through 0.10 on the weekly close.
OBV (On-Balance Volume): OBV is currently above its MA, which is the second confirmed bullish confirmation. Volume trend is supporting the price move this week, meaning this is not a price surge on thin or fading volume — real volume-backed conviction is behind the current candle. This is an important supporting detail for the bull case.
POC Support/Resist: The Point of Control sits at $69,331.28. As of this writing, price at $68,624.79 remains below the POC by approximately $706, or roughly 1%. The prior coverage identified the POC at $65,669.55 — price has since climbed well above that level, which itself represents progress, and the current POC of $69,331.28 represents the updated high-volume node that now needs to be cleared. Price closing above the POC on a weekly basis was the specific entry gate set in the prior post, and that gate remains technically unmet as of this writing — though the gap is narrow enough that the close of this week's candle will be decisive.
Bull/Bear Score: 2/4 Bull (Moderate) and 0/4 Bear (Weak). The confirmed bullish factors are CMF above 0.05 and OBV above its MA. The unconfirmed bullish factors are RSI (needs to be below 40 — it's at 47.2) and POC (price is currently below it). The bear side registers zero confirmations — no bearish confirmation of any kind is active. This is a mixed-but-directionally-bullish picture: partial confirmation, with no counterargument from the bear side.
Bottom Catch Ready: K value is currently at 34.1. The Bottom Catch condition requires K to be in the 10–20 zone or the 50–60 zone. At 34.1, K sits between the two zones and does not satisfy the condition. This is not a Bottom Catch setup at this moment — the signal is watching from the sidelines, neither in the lower nor the upper trigger window.
Squeeze & Momentum: No compression is showing on the squeeze meter — there is no unusual volatility contraction building at this time. This means the current move is not emerging from a coiled, energy-stored base; it is an organic, trend-driven price push rather than a breakout from prolonged compression. The momentum reading is −6,544.98, with a rising arrow (▲) and a delta of +184.55. Applying the zero-convergence rule: the reading is negative and rising (moving toward zero), which means the bearish momentum that has dominated this chart is weakening — this is bearish momentum decelerating, not bullish momentum strengthening. The on-chart label confirms this as "Bearish, weakening," which is consistent with the independent derivation. The delta of +184.55 on a reading of −6,544.98 is relatively small in proportional terms, suggesting the deceleration is real but still gradual — momentum has not yet crossed into positive territory and still has considerable ground to cover before it reflects a genuine bullish push. This is consistent with the price action: the chart is clearly recovering, while momentum has not yet caught up — expected given how the calculation lags real price action.
Last Signals
Spring Is the Governing Signal — Bottom Structure Intact
- Last Spring: ▲ Spring — 41 bars ago (approximately 9–10 months ago on the weekly chart). The dot is shown as an open circle, indicating it has not yet fully activated into a confirmed uptrend continuation.
- Last Bottom Catch (B/C): 43 bars ago (approximately 10 months ago). Slightly earlier than the Spring, suggesting the initial low was identified by the Bottom Catch system before the Spring signal formally triggered.
- Last Double Dragon (D/D): 69 bars ago (approximately 16 months ago). This is the oldest signal in the sequence, predating the Spring by over six months — it flagged an earlier structural low in the cycle, well before the current sequence of accumulation signals began firing.
The Spring signal, fired approximately 9–10 months ago, remains the governing accumulation signal for this chart. What the signal sequence tells us is that this system identified a meaningful structural low roughly ten months back, and Bitcoin has been working through the post-Spring accumulation phase since then — grinding, re-testing, and consolidating before this week's attempted breakout move. The current Bull Flip, if confirmed at the weekly close, would represent the culmination of that long post-Spring base-building process. The open-circle status on the Spring (rather than a filled dot) is a reminder that the signal sequence is still provisional from a completion standpoint — the weekly close will help determine whether this Spring graduates into a confirmed new trend.
MA Filters
Short-Term Structure Turning While Long-Term Trend Remains Intact
The MA Filters section shows a meaningful divergence between the two distinct checks it runs. All MAs Aligned is showing neither Bull nor Bear — a cross (✗) on both sides. This means the short, medium, and long moving averages do not all agree with a single direction right now. Given the timing (a fresh bull flip bar), this is entirely expected: the faster short and medium MAs have been rolling over and repositioning, but have not yet cleanly aligned in a bullish stack across all three. The All MAs Aligned check is sensitive and fast-reacting, and it will often show ✗/✗ right at the moment of a flip before the slower moving averages have time to catch up.
Strong Trend, by contrast, reads Bull (✅ Bull, ✗ Bear). This checks only the long-period moving average — whether price is above it and whether that long MA is still sloping upward. The fact that Strong Trend still reads Bull means the long-term structural trend has not broken down: price remains above the long moving average and that average is still sloping up. This is a genuine lagging-versus-leading divergence, not a contradiction: the short-term structure (All MAs Aligned) has broken out of a clean bullish alignment as the chart went through its correction, while the longer-term trend structure (Strong Trend) never fully capitulated. The practical read: the longer-term bull structure held, and the fresh Bull Flip this week may represent the short-term structure beginning to re-align with that still-intact long-term trend.
Signal & Action
Provisional Bull Flip Firing — Watch the Weekly Close Against the POC
Bitcoin is currently printing the exact type of candle the prior July 30 analysis identified as the entry trigger — a weekly bull flip — but that prior analysis also required the candle to close above the POC at $69,331.28. As of this writing, price at $68,624.79 has not yet closed above that level, and the weekly candle is still forming. The prior entry conditions have been partially met (the flip is firing) but not fully met (no confirmed close above POC yet). The setup is live and developing — the right posture is to be watching this week's close, not acting ahead of it.
For Existing Holders
If you were already holding Bitcoin from the Spring-era accumulation zone or from any scaling-in done during the downtrend, this week's candle is exactly the kind of structural development that justifies holding your position. The long-term trend structure (Strong Trend Bull) never broke, and the Fund Sim has been recovering. A confirmed weekly close above the POC at $69,331.28 would meaningfully strengthen the case for continuing to hold and even adding. Do not exit into this move prematurely — the chip picture (81.2% Locked Chips) suggests there will be resistance above current levels, but that resistance is the overhead supply problem for new buyers, not a reason for established low-cost holders to exit.
- Hold trigger: Maintain position as long as weekly candles continue to close above the key support zone near $65,000–$65,669 (former POC from prior post).
- Stop trail: Trail the stop up to just below the new POC at $69,331.28 if/when this week's candle closes above it — then that level becomes your structural line in the sand.
- Watch: Weekly close vs. $69,331.28 POC; CMF staying above 0.05; OBV continuing to hold above MA.
For New Entries
Do not enter before the weekly close — wait to see whether this candle actually closes as a bull flip above the POC, since a close below $69,331.28 or a reversal of the flip would negate the setup entirely.
- First entry (33%): On confirmation of this week's weekly candle closing green (Bull Flip) and above the POC at $69,331.28 — enter on the open of next week's candle if that condition is met.
- Second entry (33%): On any pullback retest of the POC ($69,331.28) that holds as support on a weekly closing basis, with CMF remaining above 0.05 and OBV above MA.
- Third entry (34%): On a confirmed breakout above the prior high zone near $78,000–$79,000 (visible prior weekly resistance on chart) with momentum turning positive (momentum reading crossing above zero) and RSI clearing 50 on a sustained basis.
Stop Loss
The structural stop for any new entry triggered by this week's close sits at approximately $62,750 — just below this week's current low of $62,751.10, which represents the low of the Bull Flip candle itself. A weekly close below this level would invalidate the flip and signal a return to downside pressure. The prior post identified a stop at $56,500, which held well — price never came close to that level, and the downside was more contained than that worst-case scenario implied. For the current setup, the tighter stop near $62,750 is more appropriate given the higher base price now established.
Take Profit Targets
| Target | Level | Reasoning | Action |
|---|---|---|---|
| T1 | $69,331 (+1% from current) | POC — the highest-volume price node on the chart; reclaiming and holding it on a weekly close is the first structural gate. Price needs to close above here for the bull case to be confirmed. | Trim a small amount if this level acts as resistance at the weekly close; hold the rest if it clears cleanly. |
| T2 | $73,500–$74,000 (+7–8% from current) | Prior swing high / reaction zone visible on the weekly chart from the most recent rally before the downtrend began — a level where price has visibly stalled and reversed before. Also coincides approximately with the lower boundary of the LC (Locked Chips) zone where underwater sellers are likely concentrated — confluence of prior swing high and LC supply zone. | Trim 25–30% of position into strength; watch price action at this level closely for absorption or rejection. |
| T3 | $78,251–$79,000 (+14–15% from current) | Prior significant swing high visible on this weekly chart — the high of the most recent major weekly rally before the current downtrend. Sitting well within the LC zone, representing substantial overhead supply from underwater holders. High-conviction resistance level. | Trim another 25–30% of remaining position; reassess momentum and chip distribution before holding through this zone. |
| T4 | ~$85,000 (+24% from current) | Upper region of the LC chip zone — at this price level, a meaningful portion of the 81.2% locked chips would begin to break even or move into profit, reducing selling pressure and potentially opening the door to cleaner price action above. Also aligns with prior consolidation structure visible on the weekly chart in the $84,000–$86,000 range. | Trim further if momentum has not yet turned clearly positive (momentum still negative at that point); let remaining runners ride if momentum has crossed above zero. |
| T5 | ~$99,000–$100,000 (+44–46% from current) | Prior all-time-high zone visible on the weekly chart — the peak of the previous major bull run. This is the ultimate overhead resistance level and the level at which the overwhelming majority of the LC chip distribution would convert to profit, dramatically changing the supply dynamic. Strong confluence: prior ATH swing high AND full LC zone clearance. | Take substantial profits here; only carry a small runner if a confirmed Golden Cross (PC SMA crossing above LC SMA) has occurred by this point. |
Accumulation Levels
The Trend State is a provisional Bull Flip as of this writing — not a confirmed Downtrend — so a real accumulation level table is appropriate here, contingent on this week's candle confirming the flip at the close. If the candle reverses and closes as a downtrend continuation rather than a confirmed Bull Flip, these levels should be re-evaluated at that time.
| Level | Price Zone | Structural Reason | Action |
|---|---|---|---|
| L1 | $69,331 (approx. current price) | POC — the highest-volume price node. A retest of the POC from above (after a confirmed close above it) would be a classic, high-conviction accumulation opportunity. This is the single most structurally meaningful level on the chart. | Add on confirmed retest of POC from above, provided CMF remains above 0.05 and weekly candle closes above POC. |
| L2 | ~$65,500–$65,700 (approx. −4% from current) | Prior POC from the July 30 coverage ($65,669.55) — a well-established high-volume node that has acted as a magnet and support level. Confluence with prior POC support and a prior swing low reaction zone visible on the weekly chart. | Scale into a second tranche on any pullback to this zone, provided the weekly candle closes above it with OBV still above MA. |
| L3 | ~$62,750–$63,000 (approx. −8% from current) | The low of the current Bull Flip candle ($62,751.10) — this is the structural low that defines the flip. A retest of the flip candle's low that holds is a meaningful support test. Also coincides with the short moving average (yellow MA) current level visible on the chart. | Add defensively at this zone only if the weekly close holds above it and Bull Flip status is maintained; treat a close below $62,750 as a stop-loss trigger instead. |
Worth noting: for Bitcoin's most reliable accumulation zone read, the Monthly chart tends to give the clearest picture, since higher timeframes filter out the noise that can make shorter-term levels less dependable — and given the size and significance of the LC chip overhang (81.2%), seeing how those levels look on the Monthly is particularly worthwhile before sizing up aggressively.
This is not financial advice. Always manage risk appropriately and never risk more than you can afford to lose.
Chart: BTCUSDT Weekly — Binance | August 19, 2026
Plain English
Bitcoin has had a rough stretch — most people who bought over the past year or so are still sitting on losses, and the chart has been in a confirmed downtrend. But this week something potentially significant is happening: Bitcoin is up around 9% and the trend indicator is flipping green for the first time in a while. That's promising, but this week's candle hasn't closed yet, so it's all provisional — it could still reverse. The prior analysis said wait for exactly this kind of green flip candle, but also required it to close above a key price level of around $69,331, which it hasn't quite done yet as of right now. If you're already holding Bitcoin from lower levels, hold on and watch the weekly close. If you're thinking about a new entry, wait for that confirmed close before acting — and it's also worth pulling up the Monthly chart to make sure the bigger picture agrees with what the Weekly is showing, since a fresh weekly flip is most reliable when the Monthly is also pointing in the same direction.






Leave a Comment