
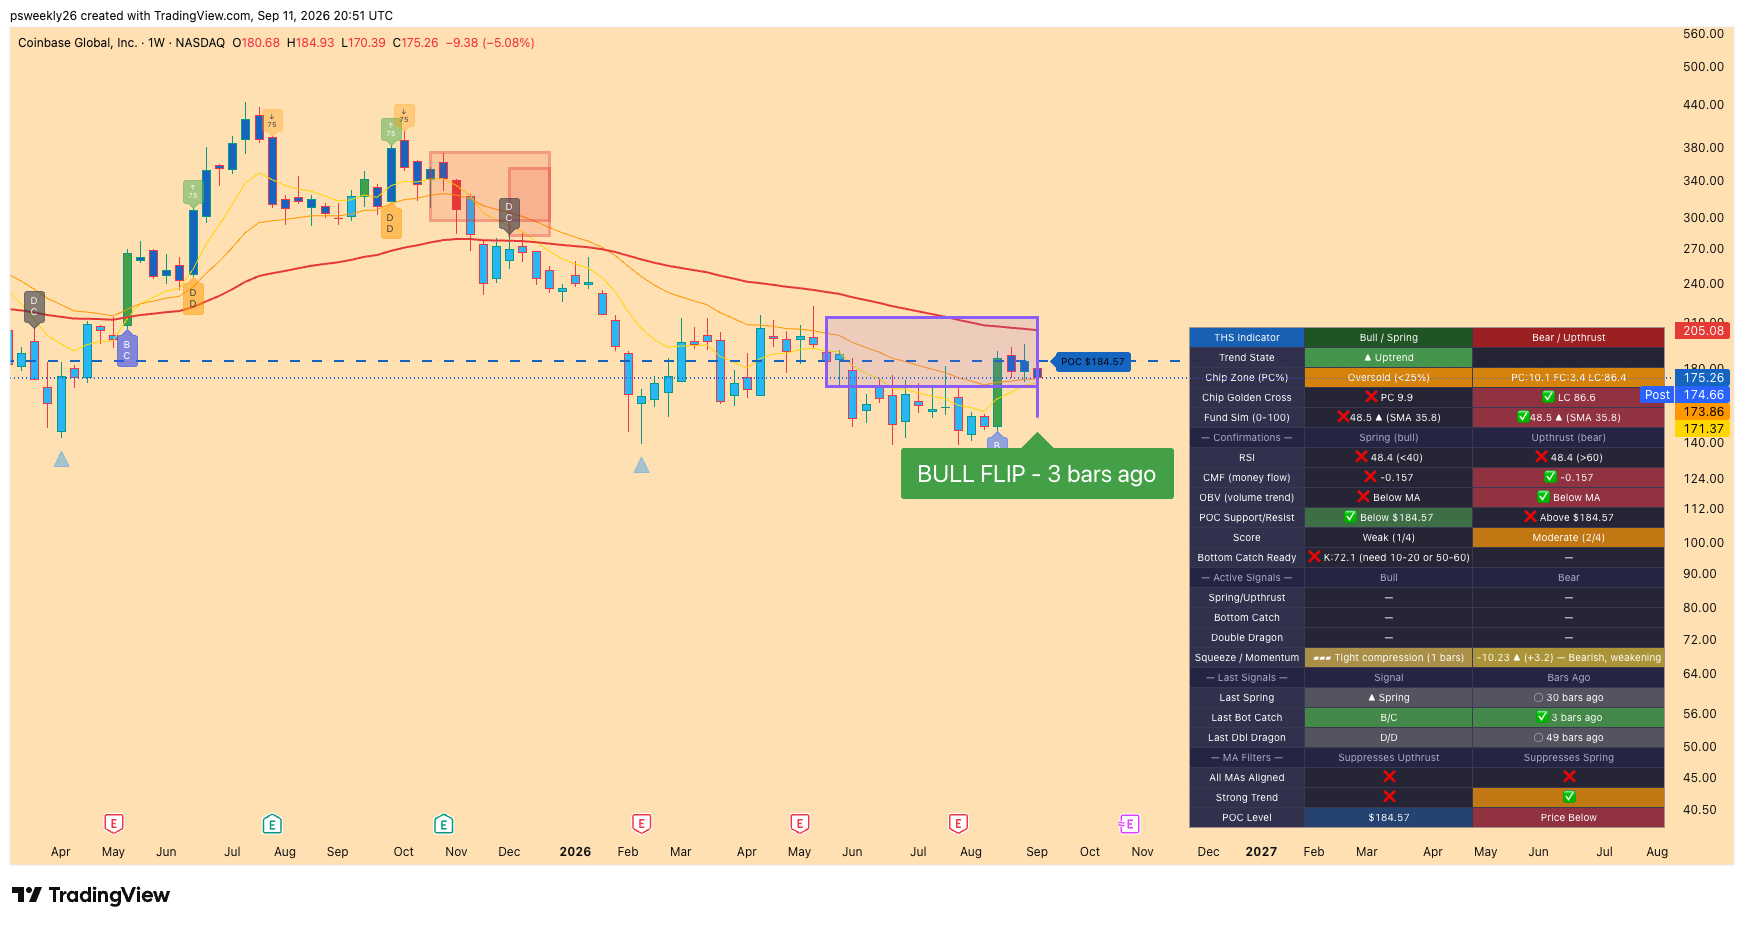
Don't worry about squinting at the small dashboard in the chart image above — every reading from it is broken out clearly in the summary table below.
Plain English
This chart pulled back hard this week, and it's worth naming the real setbacks plainly rather than spinning them — but there's a genuine positive underneath the decline too. Coinbase closed down over 5%, falling back below the POC it had briefly reclaimed, and the Bull/Bear Score fully reversed back to bear-leaning after flipping bullish for the first time this arc just last week. OBV also gave back last week's reconfirmation. Here's the part worth balancing against that: even after a rough week, price still closed above both the short and medium-term moving averages — the kind of level that tends to give way first in a real breakdown, and it didn't. CMF, which had worsened for three straight weeks, also improved slightly. The Bull Flip remains technically active and unreversed. This reads as a real step back inside a structure that's bent, not broken.
Snapshot & Big Picture
Coinbase Global, Inc. operates the largest U.S. cryptocurrency exchange, providing trading, custody, and infrastructure services for retail and institutional crypto investors.
Last week's update described a genuine bounce-back — OBV reconfirming, the Score flipping bull-leaning for the first time this coverage arc, and momentum's recovery accelerating sharply. This week tested that improvement directly.
The governing signal remains Uptrend — Bull Flip — 3 weeks ago, technically unreversed, and the current candle is showing as a dark blue continuation bar.
This week's candle opened at $180.68, ran to a high of $184.93, dropped to a low of $170.39, and closed at $175.26 — down $9.38, or -5.08% on the week, undoing most of last week's recovery.
Last covered on September 4, 2026, when the board showed Uptrend, Bull Flip 2 weeks old, a close of $184.64, and a POC of $195.25.
| Factor | Reading | Signal |
|---|---|---|
| Prior Coverage | Sep 4, 2026 — Uptrend, Bull Flip 2 weeks old, close $184.64, POC $195.25 | |
| Trend State | ▲ Uptrend — Bull Flip — 3 weeks ago | |
| Chip Zone (PC/FC/LC) | Oversold (<25%) — PC 10.1% / FC 3.4% / LC 86.4%, down from PC 13.1% / LC 83.3% on Sep 4 | |
| Chip Golden Cross | PC SMA 9.9 vs LC SMA 86.6 — still a Death Cross, gap narrowed slightly further to 76.7 from 79.5 on Sep 4 | |
| Fund Simulation | 48.5 ▲ (SMA 35.8) — essentially flat versus 48.8 ▲ (SMA 28.2) on Sep 4, though the edge over its own SMA narrowed sharply as the SMA caught up | |
| RSI | 48.4 — down from 51.3, still clean neutral | |
| CMF (Money Flow) | -0.157 — improved from -0.165 on Sep 4, the first improvement after three straight weeks of deepening | |
| OBV (Volume Trend) | Below MA — reversed from last week's Above MA reconfirmation, undoing that improvement after just one week | |
| POC Support/Resist | Price closed $9.31 below the $184.57 POC — falling back under it after briefly reclaiming it two weeks ago; the POC itself eased from $195.25 | |
| Bull / Bear Score | Weak 1/4 Bull (POC) — Moderate 2/4 Bear (CMF, OBV), reversing from Moderate 2/4 Bull — Weak 1/4 Bear on Sep 4 — undoing last week's first bull-favoring board this arc | |
| Bottom Catch Ready | K:72.1 (need 10-20 or 50-60) — not ready; last week's carryover qualification has fully expired | |
| MA Filters | All MAs Aligned: neither — Strong Trend: Bear, both unchanged from Sep 4 | |
| Squeeze / Momentum | Tight compression, new this week (was Moderate) — Momentum -10.23 ▲ (+3.2), Bearish, weakening, a smaller delta than Sep 4's +5.47 |
Overall: this week genuinely undoes a lot of what last week built. The Score flipped back to bear-leaning, OBV lost its reconfirmation, the chip base worsened, and price fell back below a POC it had only just reclaimed. Set against that: CMF's three-week deterioration streak finally broke, even if only marginally, and this week's decline actually tightened the squeeze reading to Tight compression — a fresh coil worth watching, not present at all last week. The Bull Flip remains technically active and unreversed, and Strong Trend still hasn't confirmed bear at any point across this whole arc, but this was a real step back rather than a pause within an otherwise clean recovery.
What the Chips Are Telling Us
- Profitable Chips (PC): 10.1% — down from 13.1% on Sep 4
- Float Chips (FC): 3.4% — little changed from 3.6%
- Locked Chips (LC): 86.4% — up from 83.3%
The chip base gave back last week's modest improvement and then some — still firmly classified Oversold, and now at one of the weaker readings recorded across this coverage arc.
The Golden Cross kept narrowing regardless — PC SMA 9.9 vs. LC SMA 86.6, a 76.7-point gap, down from 79.5 on Sep 4. Still a deep Death Cross, but the smoothed measure continues its slow, steady improvement even as the raw snapshot worsened this week.
Fund Simulation
Flat in Absolute Terms, Less Convincing in Relative Terms
Fund Sim reads 48.5, rising (▲), against an SMA of 35.8 — essentially unchanged from 48.8 ▲ (SMA 28.2) on Sep 4 in raw terms. But the SMA jumped considerably, narrowing the reading's edge over its own average from +20.6 to +12.7. Still close to the 50 confirmation threshold, but the setup is less fresh than it looked a week ago.
Confirmations
OBV Retreats, CMF Finally Turns
RSI reads 48.4, down from 51.3 — still clean neutral, unremarkable given this week's decline.
CMF reads -0.157, an improvement from -0.165 last week — the first improvement after three consecutive weeks of deepening outflow. Still negative and still confirming bear on this dashboard, but the direction changed for the first time in this stretch.
OBV reversed to Below MA, undoing last week's reconfirmation after just a single week. The one bullish volume-trend flip this coverage arc showed has now failed to hold twice.
POC Support/Resist: price closed at $175.26, $9.31 below the $184.57 POC — falling back under a level it had only just reclaimed two weeks ago. The POC itself eased to $184.57 from $195.25.
Bull/Bear Score: Weak 1/4 Bull (POC) — Moderate 2/4 Bear (CMF, OBV), reversing from Moderate 2/4 Bull — Weak 1/4 Bear a week ago. Last week's milestone — the first bull-favoring board this coverage arc had shown — didn't hold a second week.
Bottom Catch Ready: K now reads 72.1, with no qualifying carryover remaining — last week's in-zone status has fully expired.
Squeeze & Momentum
A Fresh Coil Starts Forming
Compression tightened to Tight this week, up from Moderate on Sep 4 — a new, notable development. Momentum reads -10.23, rising (▲), with a delta of +3.2 — smaller than last week's +5.47, but still improving. Per the zero-convergence rule, a negative reading that's rising is moving toward zero — the bearish push continues weakening, matching the dashboard's own "Bearish, weakening" label, just at a gentler pace than last week's sharp acceleration.
Last Signals
Clean Aging, Nothing Fresh
- Last Spring: 30 bars ago, up from 29 — aged exactly one bar
- Last Bottom Catch: 3 bars ago, up from 2 — same clean aging
- Last Double Dragon: 49 bars ago, up from 48 — same clean aging
All three signals, plus the Bull Flip label itself (2 weeks ago → 3), aged by exactly one bar this week — clean, consistent tracking with no gaps to flag.
MA Filters
Still the One Area That Hasn't Moved
All MAs Aligned reads neither bull nor bear, unchanged from Sep 4. Strong Trend still reads Bear, unchanged across this entire coverage arc — the slowest, most conservative measure on this board continues to say the long-term structure hasn't actually turned, regardless of this week's decline or last week's bounce.
Signal & Action
A Real Step Back, Not Just a Pause
The Bull Flip remains technically active, but this week genuinely reversed most of last week's improvement — the Score flipped back bearish, OBV lost its reconfirmation, and the chip base worsened. CMF's small improvement and the fresh Tight compression reading are the only genuine positives this week produced.
For Existing Holders
The Sep 4 stop reference (a close below that week's own low of $172.03) was breached intraweek — this week's low of $170.39 traded below it before the close recovered somewhat, but the close itself ($175.26) sits below where last week's plan wanted to see continued strength.
- Hold trigger: a weekly close continuing to hold above this week's own low of $170.39, ideally alongside OBV attempting a second reclaim.
- Trim trigger: consider trimming into any bounce back toward the $184.57 POC.
- Exit trigger: a weekly close below $170.39 would be a real warning sign that this reversal is failing, not just cooling off.
- What to watch: whether OBV can reclaim its MA a second time and actually hold it, and whether the fresh Tight compression resolves upward or downward.
For New Entries
Confirmation Score reads Weak (1/4) Bull against Moderate (2/4) Bear — back to bear-leaning after last week's brief improvement.
- First entry (33%): On a pullback to the $173.86 medium-term MA holding on a weekly close.
- Second entry (33%): On a pullback to the $170.39-$171.37 zone (this week's low and the short-term MA) holding as support.
- Third entry (34%): On OBV reclaiming its MA a second time alongside CMF continuing to improve — the clearest sign this board's setbacks are resolving rather than compounding.
Stop Loss
The updated near-term reference is a weekly close below $170.39 — this week's own low, tighter than, and replacing, last week's $172.03 reference, which was breached intraweek this week. The deeper structural floor carried forward unchanged — a weekly close below $146.02, the origin of the entire bounce — remains the hard worst-case level.
Take Profit Targets
| Target | Level | Reasoning | Action |
|---|---|---|---|
| T1 | $195.25 (+11.4% from current $175.26) | Carried forward unchanged — the prior POC, already tested twice without a confirmed close above it, and not approached this week. | Watch for a weekly close above before treating it as reclaimed. |
| T2 | $206.09 (+17.6% from current) | Carried forward unchanged — the long-term moving average, extended forward. | No action until T1 clears first. |
| T3 | $220 (+25.5% from current) | Carried forward unchanged — still only viable if MA Filters and Strong Trend actually confirm, which they have not. | No action until Strong Trend flips. |
| T4 (Extended) | ~$280 (+59.8% from current) | Carried forward unchanged — the same prior swing high, relevant only if this evolves into a genuine, sustained trend change. | Hold only a small runner if already positioned. |
Accumulation Levels
With Trend State still reading a confirmed, unreversed Uptrend, an accumulation table remains appropriate — though this week's setback argues for more patience than last week's version.
| Level | Price Zone | Structural Reason | Action |
|---|---|---|---|
| L1 | ~$173.86 (-0.8% from current) | The medium-term moving average — the nearest support, sitting just below current price. | Add on a weekly close holding above. |
| L2 | ~$170.39-$171.37 (-2.8% from current) | This week's own low and the short-term moving average sit just $0.98 apart — effectively one confluent zone, tested directly this week. | Add on a weekly close holding this zone. |
| L3 | $146.02 (-16.7% from current) | Carried forward unchanged — the origin of the entire bounce and the hard structural floor. | Deep-value add only, sized small. |
Worth repeating: for COIN's most reliable accumulation zone read, the Monthly chart tends to give the clearer picture, since higher timeframes filter out exactly the kind of week-to-week reversal this ticker has shown across the last several updates.
This is not financial advice. Always manage risk appropriately and never risk more than you can afford to lose.
Chart: COIN Weekly — NASDAQ | September 11, 2026






Leave a Comment