
THS Trend Candles System | Monthly | September 22, 2026
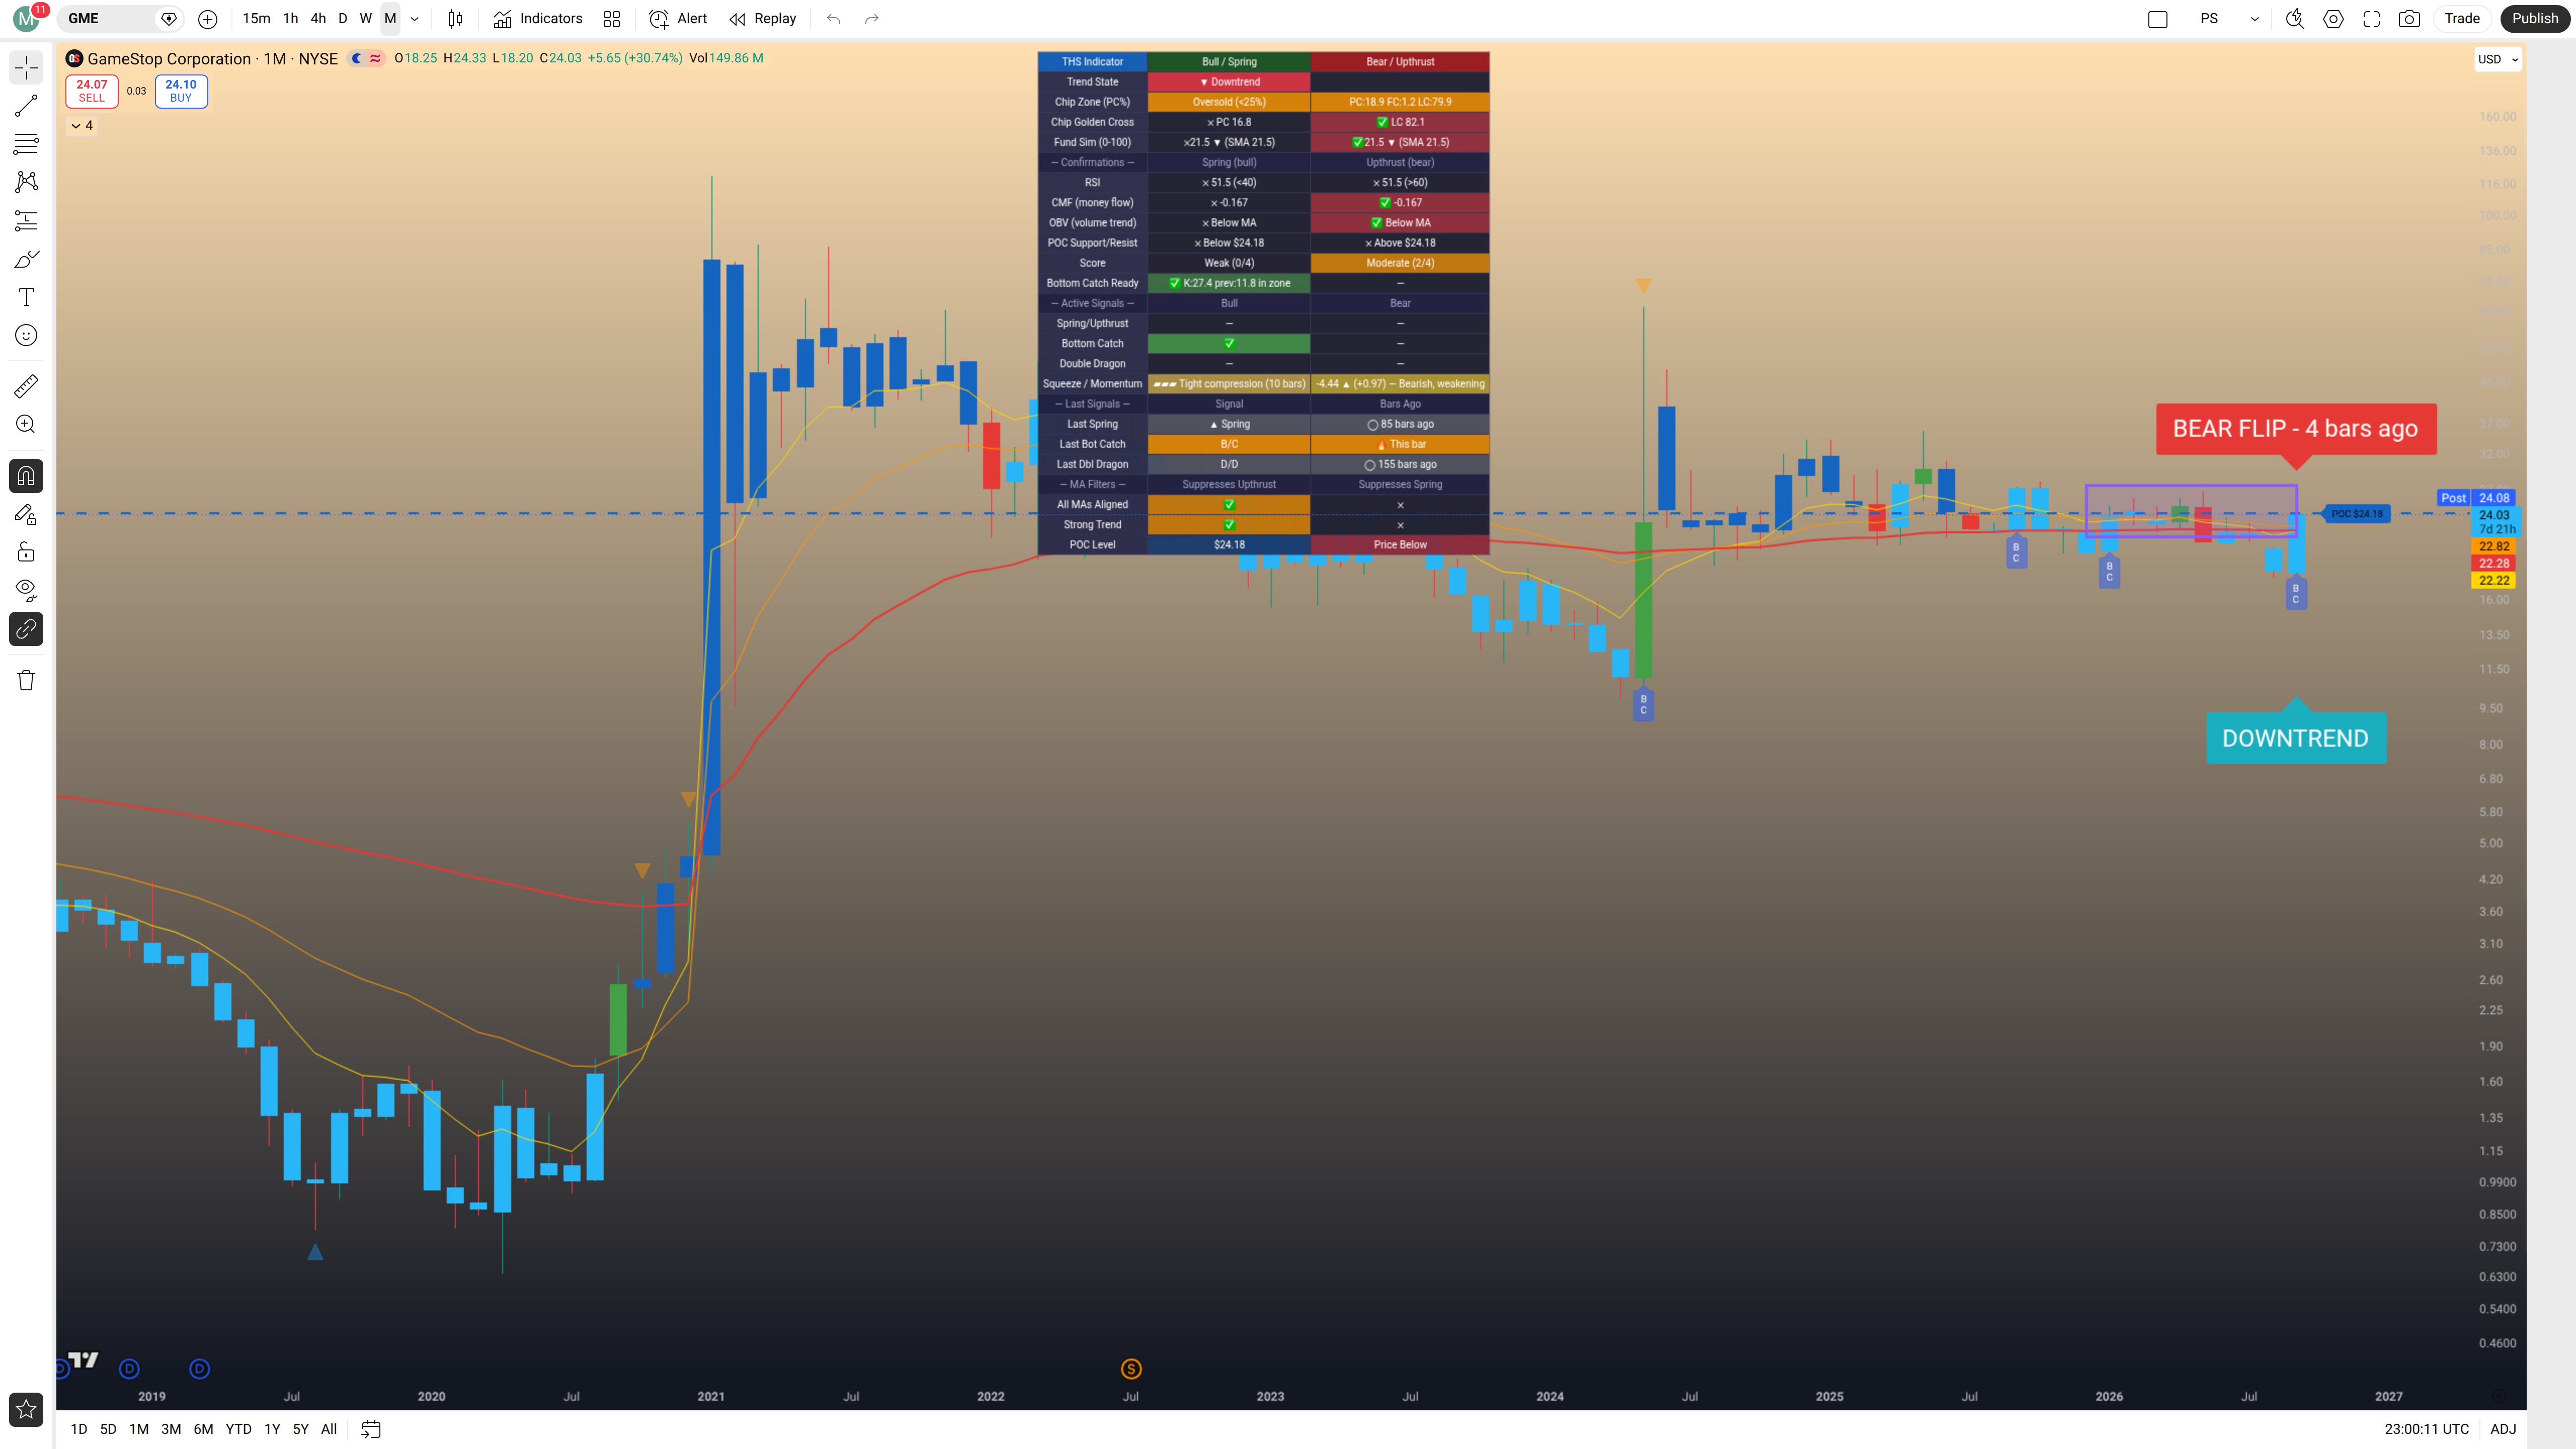
Don't worry about squinting at the small dashboard in the chart image above — every reading from it is broken out clearly in the summary table below.
Plain English
Even with a Bear Flip still technically in place from four months ago, GME is holding above its long-term moving average with a massive surge in price this month — and that structural support continuing to hold keeps the door meaningfully open for a reversal back to bullish rather than a simple continuation of the prior downtrend; worth watching closely to see if that long EMA holds as a floor, and if it does, a cautious starter position could be warranted on a confirmation close above the POC at $24.18. GameStop is the well-known video game and consumer electronics retailer that became famous for its meme-stock short squeeze in early 2021 — the company has been navigating a challenging retail environment since then, with the monthly chart showing a long, grinding downtrend that has now produced a dramatic spike this month, the kind of sharp move that happens when a heavily shorted, low-float stock catches a bid. The underlying readings support this cautious lean: the chip distribution is oversold with the vast majority of holders sitting at a loss overhead, money flow is still negative, and RSI has not yet cleared into bullish territory — but the long EMA is holding and the Bottom Catch signal fired this very bar, suggesting at minimum that the worst of the selling pressure may be trying to exhaust itself. This monthly candle is provisional and has not closed yet — the current readings, including the candle color, the OHLC values, and every indicator level, could still change before the month closes. With just over three-quarters of September already elapsed, this reading carries real weight, but it isn't locked in until the actual close.
Snapshot & Big Picture
GameStop Corporation is a specialty retailer selling video games, consumer electronics, and gaming merchandise through its physical store network and online channels. The monthly chart tells a story of a stock in a long, grinding downtrend since its legendary 2021 short-squeeze peak, with the past several years producing a relentless series of lower highs and lower lows — until this month, which has produced an explosive candle that stands out sharply against that backdrop. The governing signal is a Bear Flip that fired four months ago, making the current candle a light blue downtrend-continuation bar — though this reading is provisional and could shift before the month closes. This month, GME has opened at $18.25, surged to a high so far of $24.33, pulled back to a low of $18.20, and is currently trading near $24.03, representing a gain of approximately +30.74% with the current monthly period still in progress. This candle is provisional and has not closed yet — with a significant portion of September already behind us, this reading carries real weight, but it isn't locked in until the actual close. The Summary table below breaks out every indicator reading in detail.
| Factor | Reading | Signal |
|---|---|---|
| Trend State | Bear Flip — 4 months ago (provisional) | |
| Candle Color | Light blue — downtrend continuation (provisional) | |
| Chip Zone (PC / FC / LC) | Oversold — PC 18.9% / FC 1.2% / LC 79.9% | |
| Golden Cross | PC SMA 16.8 vs LC SMA 82.1 — Death Cross configuration | |
| Fund Sim | 21.5 ▼, below SMA 21.5 — right at the SMA | |
| RSI | 51.5 — neutral, neither oversold (<40) nor overbought (>60) | |
| CMF | −0.167 — negative, money flowing out | |
| OBV | Below MA — volume trend bearish | |
| POC Support/Resist | POC at $24.18 — price currently just below ($24.03) | |
| Bull / Bear Score | Bull: Weak (0/4) — Bear: Moderate (2/4) | |
| Bottom Catch Ready | ✅ K: 27.4 (prev: 11.8) — in zone, Bottom Catch fired this bar | |
| MA Filters | All MAs Aligned: neither bull nor bear — Strong Trend: neither bull nor bear | |
| Squeeze / Momentum | Tight compression (10 bars) — Momentum: −4.44 ▲ (+0.97), Bearish, weakening |
What the Chips Are Telling Us
- Profitable Chips (PC): 18.9% — fewer than one in five shares currently held are in profit at current prices
- Float Chips (FC): 1.2% — an extremely thin band of active, liquid supply sitting right at the current price
- Locked Chips (LC): 79.9% — nearly four out of five shares in the distribution are sitting at a loss relative to the current price
The chip picture here is about as deeply oversold as it gets. With 79.9% of the entire price-volume distribution sitting at a loss, the vast majority of GME holders who built positions above the current price are underwater and looking for any recovery to reduce their pain. That 79.9% Locked Chips reading represents an enormous wall of potential overhead supply — the moment price begins recovering meaningfully, those underwater holders will have strong incentive to sell into the strength just to get out closer to breakeven. It is a structural headwind that does not disappear quickly, even on sharp short-term spikes.
The Golden Cross configuration confirms the same bearish structural picture: the PC SMA sits at just 16.8 while the LC SMA sits at 82.1 — this is a deep Death Cross configuration, where the moving average of profitable chips has crossed far below the moving average of locked chips. This is the opposite of what you want to see for a healthy, sustainable uptrend. What it does tell us is that the distribution is so compressed into oversold territory that any sustained reversal from here would have significant room to run — there is very little overhead distribution sitting near current prices (FC at just 1.2% confirms this), which means that if the current price spike can actually hold and build, thin supply near the current level could allow price to move relatively quickly before hitting the denser LC supply bands further above.
Fund Simulation
Right at the Dividing Line — Watching for a Cross
The Fund Simulation is currently reading 21.5, sitting right at its own SMA of 21.5 — essentially pinned to the line that separates simulated accumulation from simulated distribution. The arrow direction is pointing down, which means the model's simulated fund is still technically drifting toward the distribution side rather than the accumulation side, but the margin is essentially zero at this exact moment. This is a coin-flip reading rather than a clear directional signal — neither the bear confirmation that a clean break below the SMA would represent, nor the bull confirmation that a cross above it would provide.
What makes this reading worth watching is that the Fund Sim being right at 21.5 — on both the value and the SMA — on a month where price has surged +30.74% from the open suggests that the model is genuinely undecided. A sustained follow-through to the upside in October that keeps price elevated would be likely to push the Fund Sim value above its SMA and create a more constructive reading. A reversal back below the current levels, on the other hand, would confirm the downward drift and reinforce the bear case. For now, treat this as neutral with a slight bearish lean given the downward arrow, and watch for the next monthly close to resolve the ambiguity.
Confirmations
Mixed Picture — Bottom Catch Fires, but Confirmations Remain Mostly Bearish
RSI: RSI is currently at 51.5 — a genuinely neutral reading, sitting comfortably between the oversold threshold of 40 and the overbought threshold of 60. On the bull side, RSI needs to confirm a Spring by clearing above 40 (already done) and ideally get above 60 to confirm a genuine Spring breakout. At 51.5, it has cleared the lower bar but hasn't yet made it to the upper one. The RSI positioning here is consistent with a market trying to find its footing — not a ringing endorsement of the bull case, but not a bearish confirmation either. On the bear side, RSI above 60 is needed to confirm an Upthrust, so neither side has RSI confirmation at this reading.
CMF (Chaikin Money Flow): CMF is reading −0.167 — negative and meaningfully so. For a Spring (bullish reversal) to be confirmed by money flow, CMF needs to cross above +0.05, and for genuine accumulation it needs to be above +0.10. At −0.167, this indicator is not only failing to confirm the bull case — it is actively confirming the bear case, as the CMF reading of −0.167 checks the box for the Upthrust (bear) confirmation. Real money is still flowing out of GME on a monthly basis even during this spike, which is a meaningful warning sign for anyone tempted to read the big green candle this month as a confirmed reversal.
OBV (On-Balance Volume): OBV is sitting below its moving average, which means the cumulative volume trend remains bearish. Like CMF, this checks the bear confirmation box rather than the bull one. Volume has not yet rotated to the degree required to put OBV back above its MA — a necessary condition for the volume trend to confirm that accumulation is genuinely taking hold rather than this being a low-conviction spike.
POC Support/Resist: The Point of Control is sitting at $24.18, and GME is currently trading at $24.03 — fractionally below the POC. The POC represents the price level where the most volume has historically transacted, making it a meaningful magnetic reference point. Price being this close to the POC is significant: a sustained close above $24.18 would flip this from a resistance reference to a support reference and would represent a meaningful structural improvement. Right now, price is just barely failing to reclaim the POC, which keeps this reading in neutral/slightly-bearish territory for this bar.
Bull/Bear Score: The confirmation score is Weak (0/4) on the bull side and Moderate (2/4) on the bear side. This is a direct reflection of what we're seeing across RSI, CMF, and OBV — the bear confirmations (CMF negative, OBV below MA) are outscoring the bull confirmations (RSI not yet above 60, POC not yet reclaimed above). A score of 0/4 bull is the dashboard's way of saying: the indicators are not yet aligning to endorse the bull case, even though price has had a significant bounce this month.
Bottom Catch Ready: 🔥 K: 27.4 (previous: 11.8) — in zone, Bottom Catch fired this bar. This is the most constructive individual signal on the entire dashboard right now. The Bottom Catch system detected that the K value was deeply compressed (previously at 11.8, well inside the exhaustion zone) and has now begun to turn upward, with this bar triggering the actual Bottom Catch signal. Historically, a Bottom Catch fire on the Monthly chart is a meaningful event — it does not guarantee a reversal, but it does identify a moment where the downside exhaustion pattern has reached a level consistent with prior bottoming processes. The K moving from 11.8 to 27.4 in a single month shows a sharp reversal of the momentum compression metric underlying this signal, which is consistent with the violent price spike seen this month.
Squeeze & Momentum: The compression picture is striking: the Squeeze shows Tight compression persisting for 10 bars — that is 10 consecutive months of this indicator coiling tighter than normal, which on a Monthly chart represents nearly a year of building energy. Tight compression at this duration means the eventual directional resolution, when it comes, is more likely than usual to be a sharper-than-average move rather than a gentle drift. The direction of that resolution is not guaranteed by the compression alone — and the momentum column is where this gets nuanced. Momentum is currently reading −4.44, with an upward arrow (▲) and a delta of +0.97. Applying the zero-convergence rule: the reading is negative and rising (moving toward zero) — this means the bearish push is weakening, not strengthening. The dashboard's own label confirms this: "Bearish, weakening." The delta of +0.97 is meaningful — it represents a real, non-trivial move back toward zero from what was a more deeply negative reading. This is consistent with the big monthly price surge: momentum has not yet crossed into positive territory, but it is making its way there. Whether it gets there and flips positive at the next monthly close will be one of the most important things to watch. A tight compression coil that has been building for 10 months, now showing a weakening bearish momentum reading moving toward zero, is exactly the setup that precedes a potential directional resolution — the coil appears to be unwinding, and the direction it resolves into may determine the next major leg for GME.
Last Signals
Bottom Catch Fires Fresh — Spring and Dragon Are Ancient History
- Last Spring: ▲ Spring — 85 months ago (approximately 7 years ago)
- Last Bottom Catch: 🔥 B/C — fired this bar (current month)
- Last Double Dragon: D/D — 155 months ago (approximately 13 years ago)
The signal landscape here is dominated by a single fresh event: the Bottom Catch fired on this very bar — the current monthly candle — making it the most recent and most immediately relevant signal on the chart. Bottom Catches on the Monthly timeframe are infrequent and meaningful when they do appear, because the monthly chart filters out the noise that causes shorter-timeframe signals to fire and fail repeatedly. The fact that this is firing after an extended period where the K value was deeply compressed (previously at 11.8) adds credibility to the signal — this isn't a borderline trigger, it was deeply in the exhaustion zone before turning. The Last Spring at 85 months ago (roughly 7 years) and the Last Double Dragon at 155 months ago (roughly 13 years) are both so far in the past that they carry no real forward-looking significance for the current setup. The current bar's Bottom Catch is the signal that matters, and it matters most in the context of whether the underlying confirmations (CMF, OBV, RSI) can catch up to validate it in the coming months.
MA Filters
Short-Term Structure Neutral, Long-Term Structure Neutral — No MA Is Giving a Clean Read
All MAs Aligned is showing neither a bull nor a bear checkmark — meaning the short, medium, and long moving averages are not all pointing in the same direction simultaneously. This is entirely expected at a potential inflection point like this one: after a long downtrend followed by a sharp spike, the faster short-term MAs are likely beginning to turn upward while the longer-term MA may still be pointing down, preventing the system from checking the "all three aligned" box in either direction. This is not a bearish signal in isolation — it simply means the system cannot endorse the short-term structure as cleanly directional in either direction at this moment.
Strong Trend is also showing neither a bull nor a bear checkmark — meaning the long-period moving average (the slowest and most lagging of the three) is also not in a position to confirm either a strong uptrend or a strong downtrend at current prices. Given that price has just made a sharp surge from deeply depressed levels, it is plausible that price is now sitting in the zone around the long MA rather than decisively above or below it, which would explain why Strong Trend is in neutral territory. These two MA readings agreeing on "neutral" is actually a coherent picture: GME is at a genuine crossroads, where the short-term structure and the long-term structure are both in no-man's-land relative to their respective moving averages. A sustained close above the long EMA in the coming months — which would require the current price levels to hold — would be the catalyst to push Strong Trend into a bull checkmark. Until then, the MA Filters section is simply saying: nothing is confirmed yet in either direction on the moving average side.
Signal & Action
Bear Flip in Effect, Bottom Catch Fired — Watching for Structural Confirmation
The overall posture is cautiously constructive at the margins — a Bear Flip that was established four months ago remains the governing trend signal, but the fresh Bottom Catch on the current bar and the price holding above the long EMA introduce enough nuance to avoid treating this as a straightforward short or avoid-entirely situation. The dashboard is not giving a green light for an aggressive long entry, but it is giving enough signal to merit close attention rather than dismissal.
For Existing Holders
If you already hold GME from lower levels, this month's surge is a significant development worth respecting. The Bottom Catch firing on the Monthly chart is a real signal, and holding through the current candle's close makes sense if your cost basis is well below current levels. That said, the Bear Flip is still the governing trend, CMF is still negative, and OBV has not confirmed the move — so trimming a portion into this strength to reduce risk while leaving a core position running is entirely reasonable.
- Hold/Trim trigger: Consider trimming 20-30% of position into current strength near $24, particularly if the monthly candle closes below the POC at $24.18
- Stop trail: Trail any remaining position with a stop below the long EMA (approximately $22-23 area) on a monthly closing basis
- What to watch: CMF turning positive above +0.05, OBV crossing back above its MA, and a monthly close above the POC at $24.18 — these would each be meaningful incremental confirmations
For New Entries
New entries should be staged and conditional — the Bottom Catch signal is constructive but the Bear Flip is still active and confirmations are mostly bearish, so this is a scale-in situation rather than a full-size entry.
- First entry (33%): On a confirmed monthly close above the POC at $24.18, with price holding above the long EMA — this is the minimum structural bar for an initial position
- Second entry (33%): On a subsequent monthly candle that closes above $24.18 AND shows CMF crossing above +0.05, confirming money flow turning constructive
- Third entry (34%): On a full Bull Flip signal printing on the Monthly chart — that would represent the trend structure actually reversing, not just approaching the conditions for a reversal
Stop Loss
The structural stop for any long position initiated from current levels is a monthly closing price below the long EMA, currently in the approximate $22-23 range. This is the moving average that price is currently holding above — the one structural reason that keeps the bear-flip/downtrend story from being a clean continuation lower. A monthly close convincingly below that line would mean the structural support that justifies any bullish lean here has broken, and the Bear Flip continuation would be the path of least resistance. Do not use an intra-month low as a stop on the Monthly chart — only monthly closes matter at this timeframe.
Take Profit Targets
| Target | Level | Reasoning | Action |
|---|---|---|---|
| T1 | $24.18 (~+1% from current) | POC level — the highest-volume price node in the distribution; reclaiming this as support would be a key structural milestone, but it also marks the first meaningful resistance cluster where overhead supply begins to thicken | Trim 15-20% into a close above — use it as confirmation rather than an exit |
| T2 | ~$28-30 (~+16-25% from current) | Lower boundary of the Locked Chips (LC) zone — with 79.9% LC, the dense supply of underwater holders begins to create meaningful overhead resistance in this region; this is where the first wave of "relief selling" from trapped holders is likely to emerge as price recovers | Trim 25% of remaining position — this is a high-probability supply zone |
| T3 | ~$35 (~+46% from current) | Prior swing low from the 2021-2022 post-squeeze consolidation visible on the monthly chart — a level that was previously support before breaking down, now acting as overhead resistance; this is a genuine prior structural reaction level, not an invented round number | Trim another 25% — prior support turned resistance is a legitimate take-profit zone |
| T4 | ~$50 (~+108% from current) | Upper LC zone density — as price recovers further into the locked-chip distribution, supply from underwater holders accelerates; this level represents a region where a significant portion of the accumulated LC overhead has been worked through, making it a natural area for the recovery to encounter heavier resistance | Trim remaining 50% — at this level, the speculative thesis has largely played out and risk/reward tilts to protecting gains |
| T5 (Extended) | ~$65-70 (~+170-190% from current) | Prior visible swing high on the monthly chart from the post-squeeze secondary peak in late 2021 — a level where significant overhead supply was established; this would only be relevant if a confirmed Bull Flip fires AND the broader chip distribution has restructured meaningfully (PC well above 50%); strong confluence: prior swing high AND peak LC supply zone | Full exit / close position — this is the extended, highest-conviction resistance level; only hold this long if the trend has genuinely confirmed a new uptrend structure |
Accumulation Levels
The Bear Flip fired four months ago and is technically still the governing trend signal — but price is currently holding above the long-term moving average (the thick red MA on this chart), and that is a genuine structural reason to lean toward this as potential support rather than automatically expecting the downtrend to extend further. These levels assume that long EMA support continues to hold — a genuine monthly close below it would invalidate this read and shift the picture firmly back toward the standard downtrend treatment.
| Target | Level | Reasoning | Action |
|---|---|---|---|
| L1 | ~$22-23 (~8-15% below current) | Long EMA (MA3, the thick red moving average) — the key structural support currently holding; this is the primary reason the bear case is not straightforward. Strong confluence: this is also near the bottom of this month's price range, making it a natural retest zone if price pulls back from current levels | Scale in (33%) on a retest that holds as support on a monthly closing basis — do not buy an intra-month dip to this level, wait for monthly close confirmation |
| L2 | $24.18 (~current POC — +1% from current) | POC at $24.18 — a confirmed close above the POC converts it from resistance to support and would be the clearest structural improvement this chart could show in the near term; reclaiming and holding the POC as support would be the most compelling entry trigger available | Add (33%) on a confirmed monthly close above $24.18 that holds — this is the confirmation trigger that shifts the structural read more constructively |
| L3 | On Bull Flip signal | A confirmed Bull Flip on the Monthly chart would represent a full trend reversal — this would be the highest-conviction entry signal, where the governing trend has actually turned rather than being close to turning. At that point, price, moving averages, and the trend state label would all be aligned for the first time since the bear flip | Add final (34%) — full position complete, shift focus to managing the position with trailing stops per the Stop Loss section |
This is not financial advice. Always manage risk appropriately and never risk more than you can afford to lose.
Chart: GME Monthly — NYSE | September 22, 2026






Leave a Comment