

Iran launched missiles at U.S. military facilities in Kuwait and Bahrain. The United States had just finished bombing targets near the Strait of Hormuz. Trump threatened annihilation. Again. Nuclear talks stopped. The oil chokepoint where 21% of global petroleum moves just became a war zone.
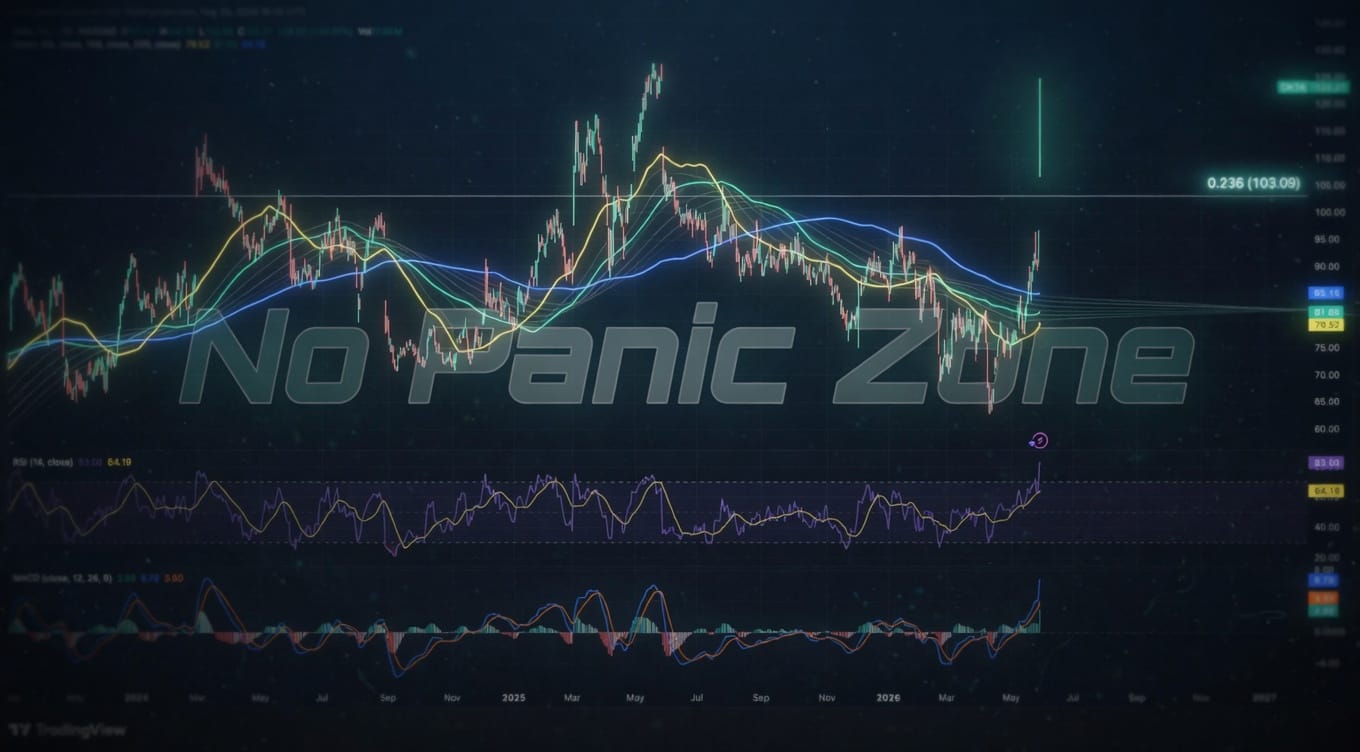
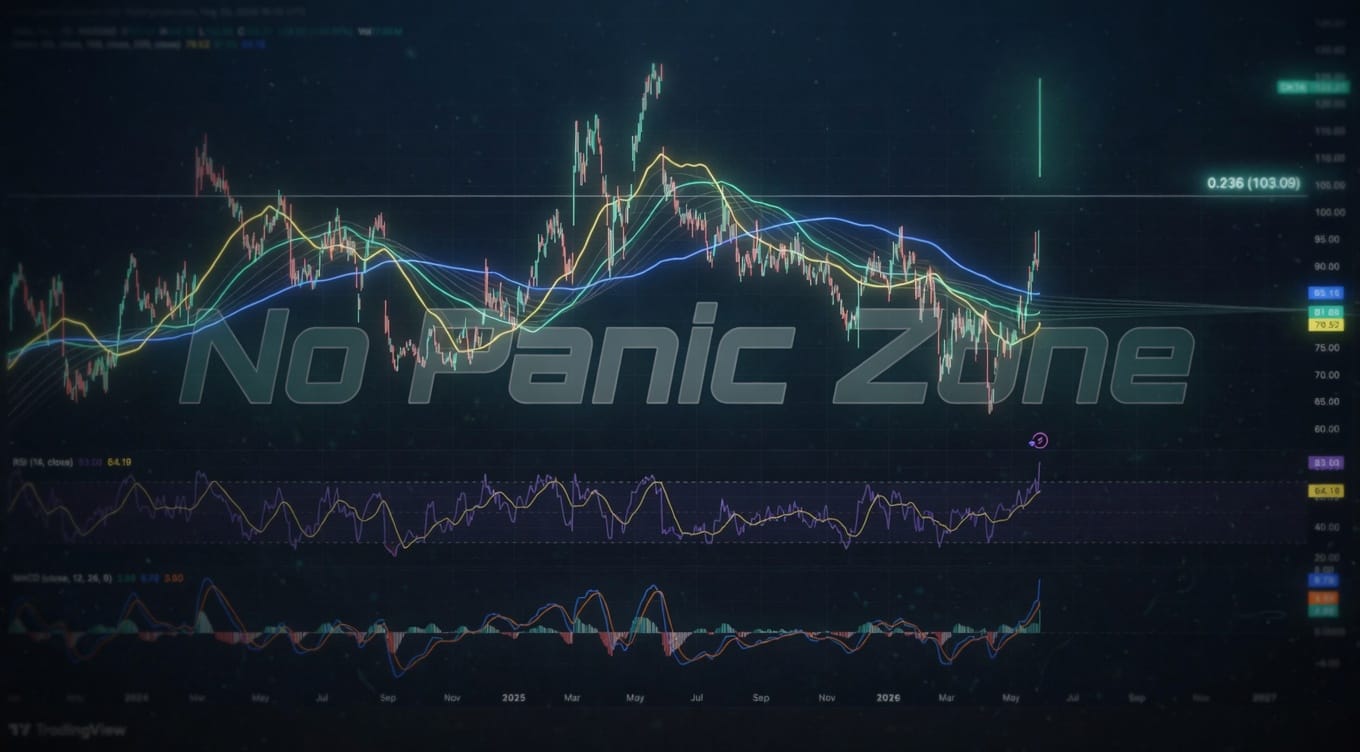
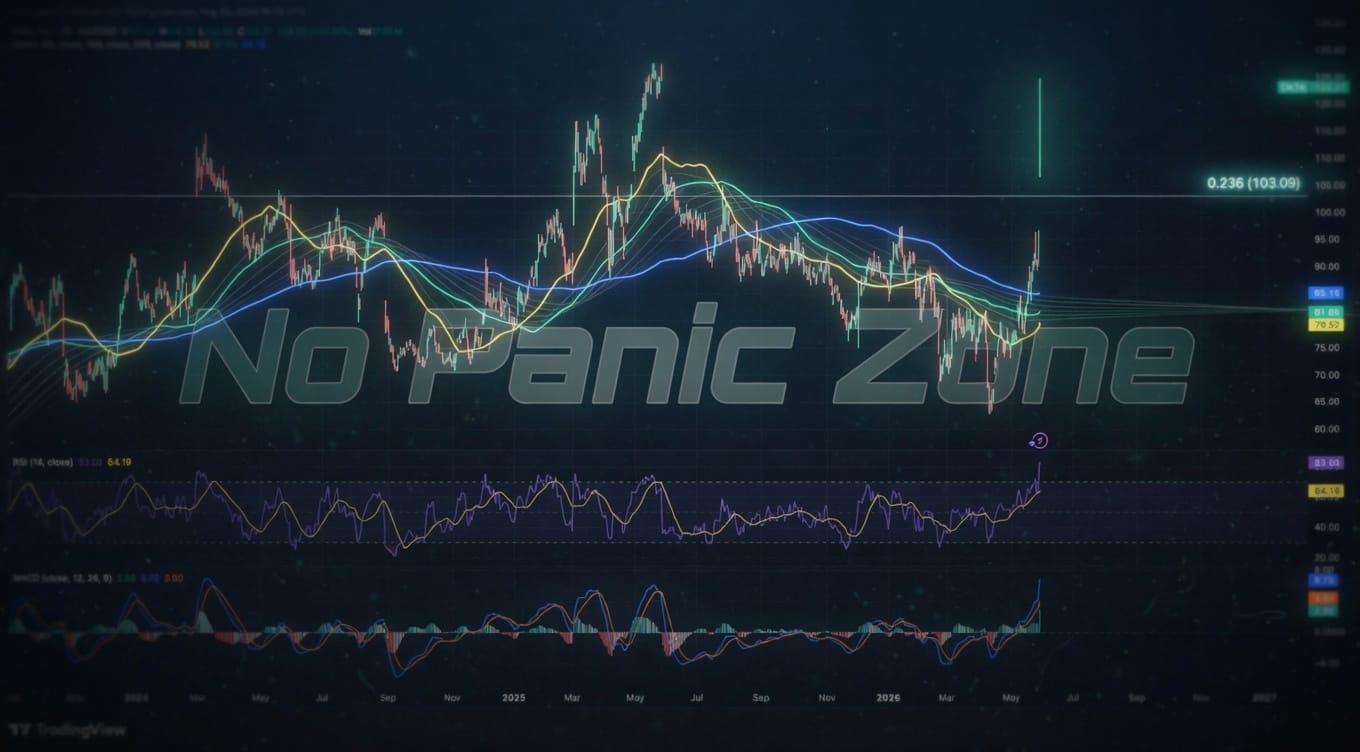
Every technical analyst on Twitter immediately opened TradingView. They drew support and resistance lines on crude oil futures. They checked the MACD. One guy posted a cup-and-handle pattern on Lockheed Martin with three flame emojis and the caption "generational buying opportunity." He has $847 in his Robinhood account.
The charts do not care that missiles flew. The 50-day moving average does not factor in radioactive fallout. Your Fibonacci retracement will not stop when Tehran gets glassed. But sure, the death cross on WTI means it's going lower.
Here's what matters to price: nothing you can predict. Iran could close the strait tomorrow. Oil hits $200. Or Saudi Arabia opens the taps and crashes it to $40 out of spite. Or Trump tweets something unhinged at 3 a.m. and futures gap up 8%. Or he doesn't. Your trendline is a crayon drawing on a napkin during an earthquake.
The geopolitical risk premium is now whatever number makes your stop loss look stupid. Defense contractors ripped higher for six hours, then gave it all back before close. Energy stocks did nothing. The VIX barely moved. The market looked at actual warfare in the Persian Gulf and shrugged.
Retail bought the dip on crude. They always do. They think tension means higher prices means they figured it out this time. They will get stopped out when the conflict escalates or de-escalates or just sits there doing nothing while theta burns their calls to zero. The chart cannot tell you which one happens. The chart cannot tell you anything except where price was before people started dying.
Photo by on Unsplash

Leave a Comment