
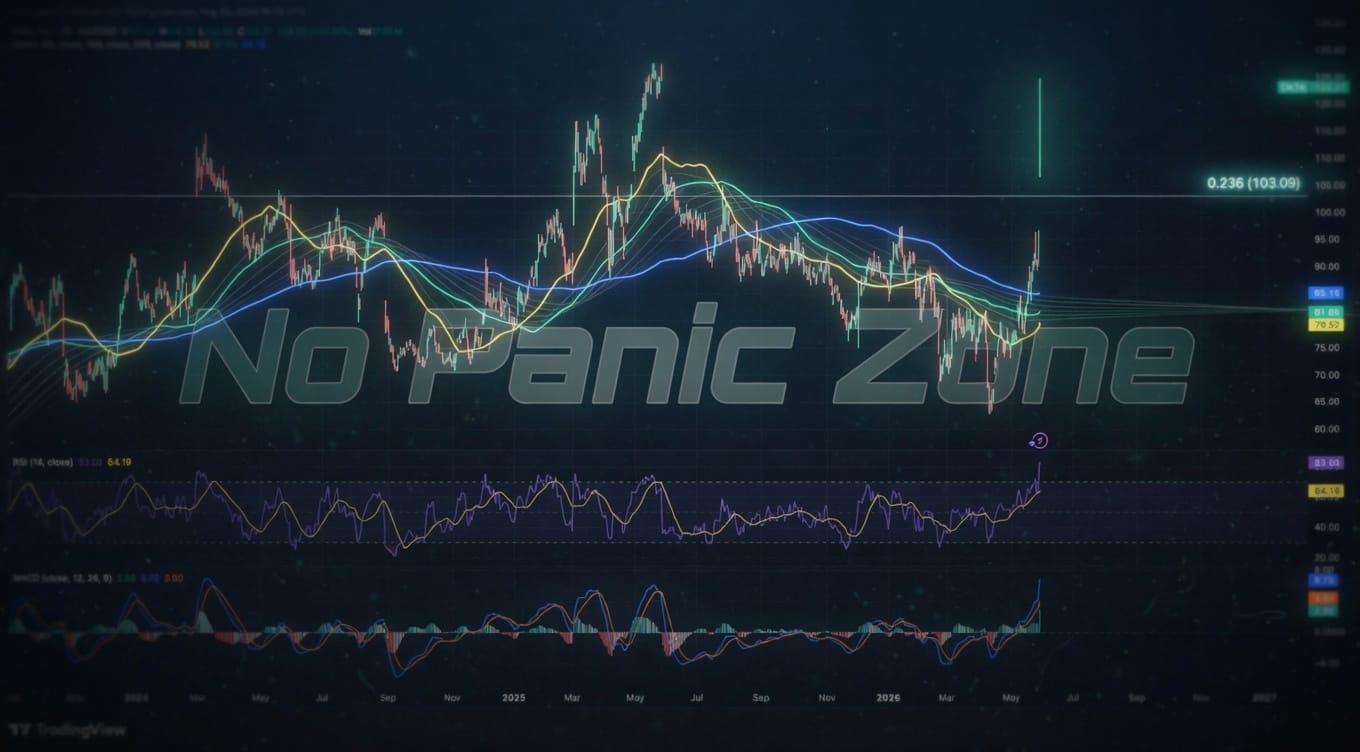
Oil jumped 4% because the president threatened to bomb a country and blockade its coast. Traders who spent six months learning Fibonacci retracements finally got to use them in a real geopolitical crisis. Must feel validating.
The NATO summit was in Turkey. Trump said the ceasefire was over. Airstrikes happened overnight. None of this information appears on a candlestick chart, which means roughly 90% of technical analysts missed it entirely. They were busy drawing triangles on the 15-minute timeframe while the commander-in-chief was discussing naval warfare on live television.
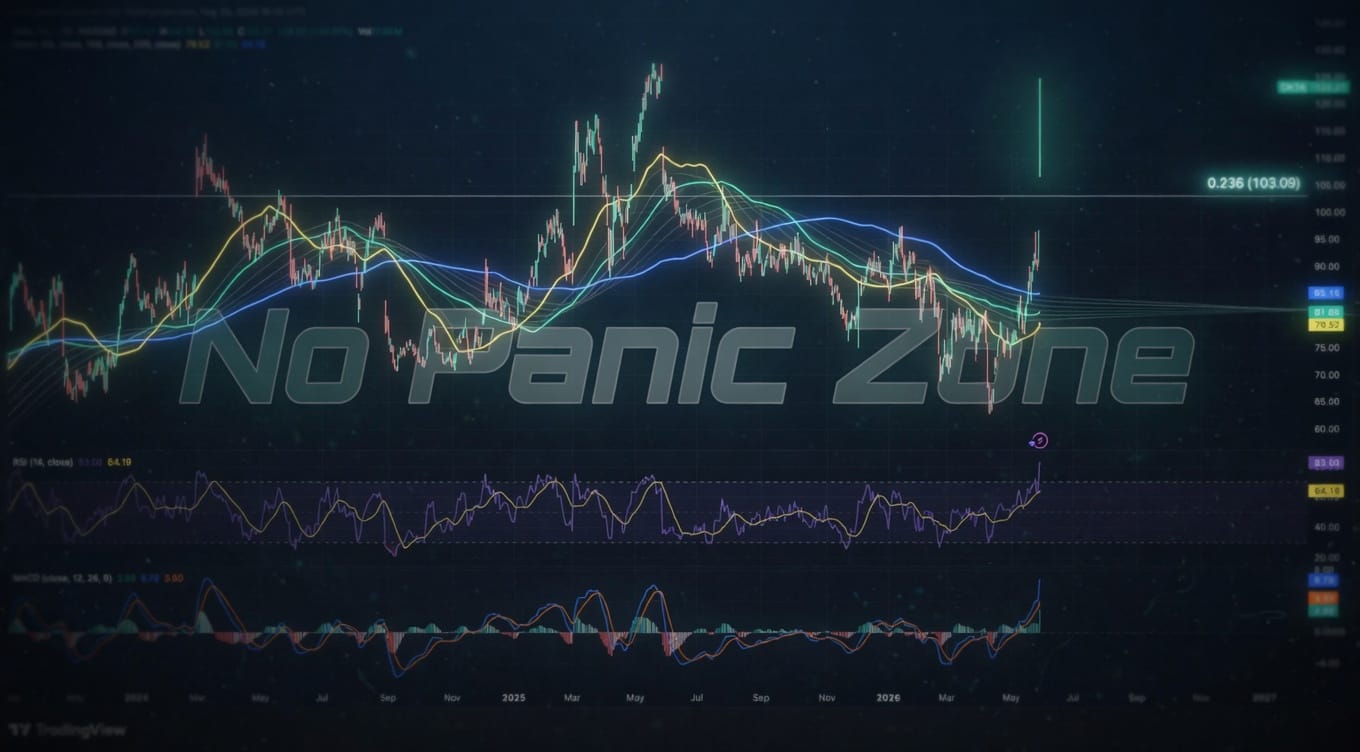
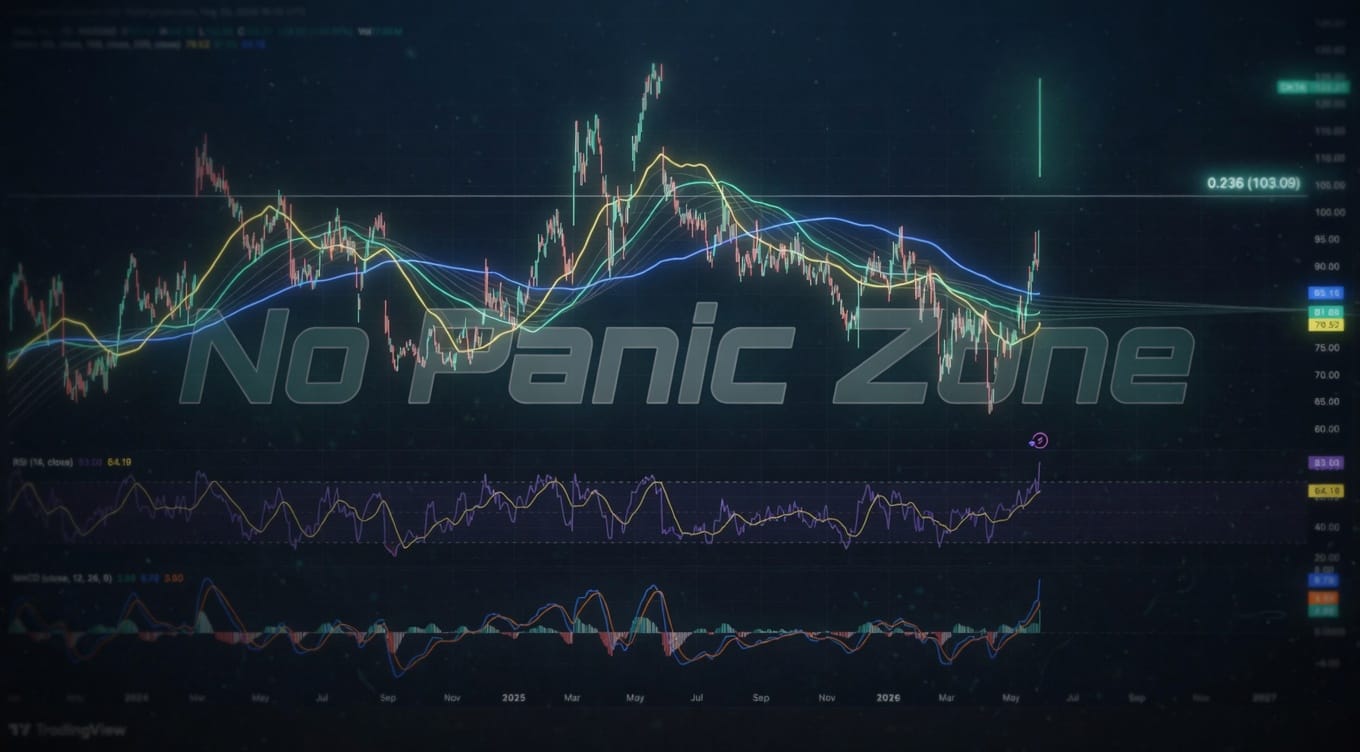
Crude spiked above resistance. Some guy with 47 followers tweeted that he called it because he spotted a bullish divergence on the RSI three days ago. He did not call it. He got lucky. The divergence had nothing to do with threats of military action in the Strait of Hormuz. But he'll screenshot his entry and sell a course by Thursday.
Naval blockades disrupt supply. Bombing refineries disrupts supply. Supply disruptions move prices. This is not a head-and-shoulders pattern. This is not an ascending wedge breaking to the upside. This is a sitting president threatening to sink tankers, and the market repricing risk in real time while day traders checked their moving average crossovers.
The 200-day moving average did not predict this. The Ichimoku cloud did not predict this. Your pivot points did not predict this. A guy in a suit stood at a podium in Ankara and said he might start a war, and that moved oil more than every support level you've marked on your chart combined.
Somewhere right now, a swing trader is explaining to his wife that he exited his long position early because the MACD showed bearish momentum, completely unaware that his timing tool doesn't account for the sitting president threatening to bomb Iran while standing next to the Turkish foreign minister.
Photo by on Unsplash



Leave a Comment