

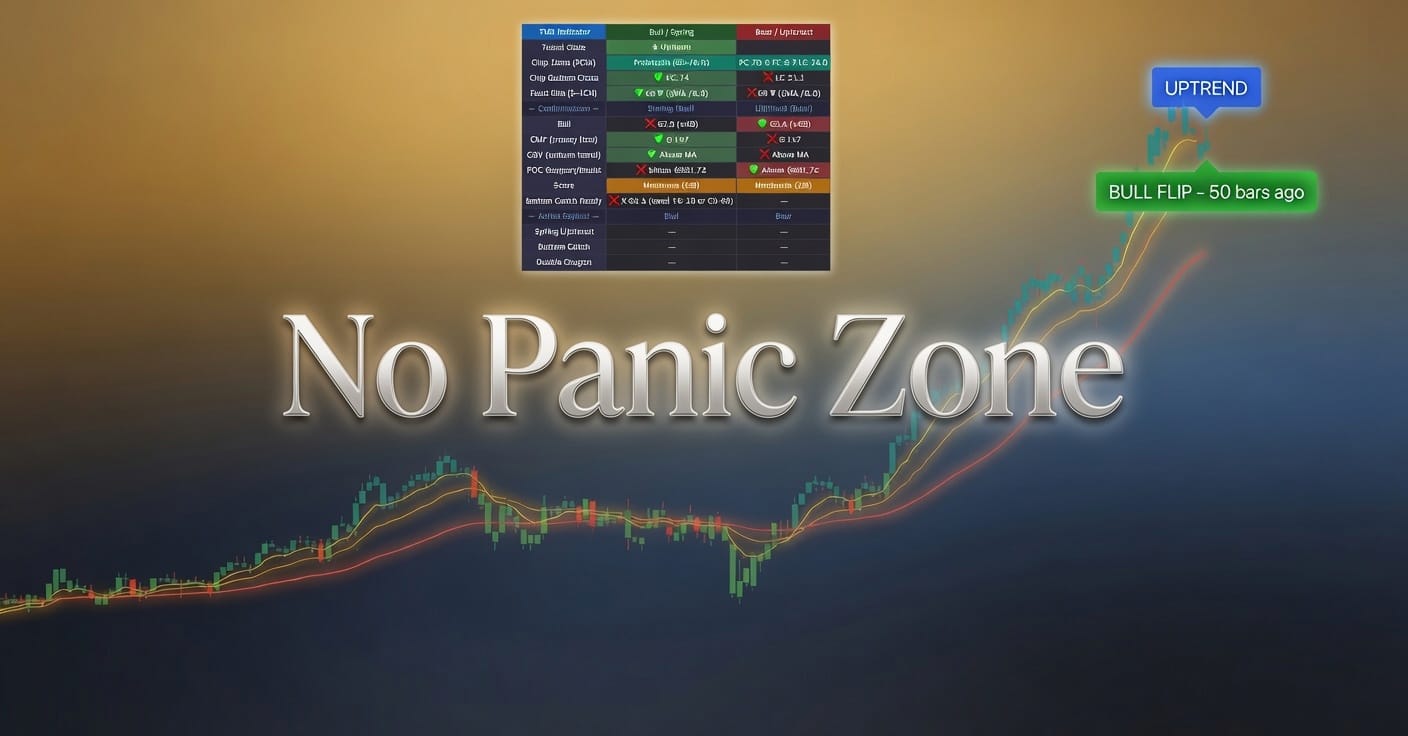
An unnamed chart analyst looked at the S&P 500 and saw the dot-com bubble. Not the actual dot-com bubble. An echo. Like a really expensive parrot that only screams warnings about 2000.
The index surged. Violently, according to the headline. Markets went up and someone decided that was violent. Your 401(k) made money and this guy clutched his moving averages like rosary beads.
Here's what happened at major market tops throughout history: markets went up before they went down. Incredible research. This analyst cracked the code. Things that rise sometimes fall. Someone get this pattern recognition on record before the Nobel committee closes for lunch.
The dot-com comparison is perfect because nothing says rigorous analysis like pointing at a chart from 26 years ago and whispering "it's happening again." Different companies. Different economy. Different interest rates. Different geopolitical landscape. But the line went up at a sharp angle so clearly we're all f*cked.
Retail traders are already selling everything to buy gold and canned beans. They read "violent surge" and pictured their Robinhood account getting mugged in an alley. They saw "major market tops" and remembered that time they bought Nvidia at the literal peak because some guy on Twitter said it was different this time.
The analyst is worried. Not worried enough to stop collecting fees for chart reading services. Not worried enough to shut down his subscription newsletter. Just worried enough to get quoted in a headline that makes other people panic.
Technical analysis is astrology for people who wear suits. This analyst drew some lines on a graph, remembered another time lines looked similar, and concluded that history repeats itself exactly. He's basically a fortune teller but with worse graphics.
The market will either go up, go down, or trade sideways until this analyst finds a new pattern that looks like a different historical disaster.
Photo by Olha Ivanova on Unsplash





Leave a Comment