

The October CPI report lands Tuesday. Economists expect headline inflation up 0.3%. Core, which strips out food and energy, is forecast at 0.2%.
Three tenths of a percent. Retail traders will treat it like a paternity test.
Here is how it goes. The number prints at 8:30 a.m. Eastern. Within four seconds, a man named @DiamondHandsDave posts a chart with seven colored lines. None of them mean anything. He is up 11% on a good day and down 40% on every other day.
Core at 0.2% means prices ex-food and ex-energy rose a little. Headline at 0.3% means prices including food and energy rose slightly more. This is the entire event. Bureau of Labor Statistics employees gather prices for a basket of goods, run the math, and publish it. The basket does not include your options losses. Those are not considered goods.
If the print matches the forecast, nothing happens. Then everything happens anyway, because futures traders need to justify their Tuesday.
If it comes in hot, the Federal Reserve will be described as "in a bind." If it comes in cool, the Fed will be described as "gaining flexibility." Same Fed. Same buildings. Same men in the same suits, staring at the same ceiling.
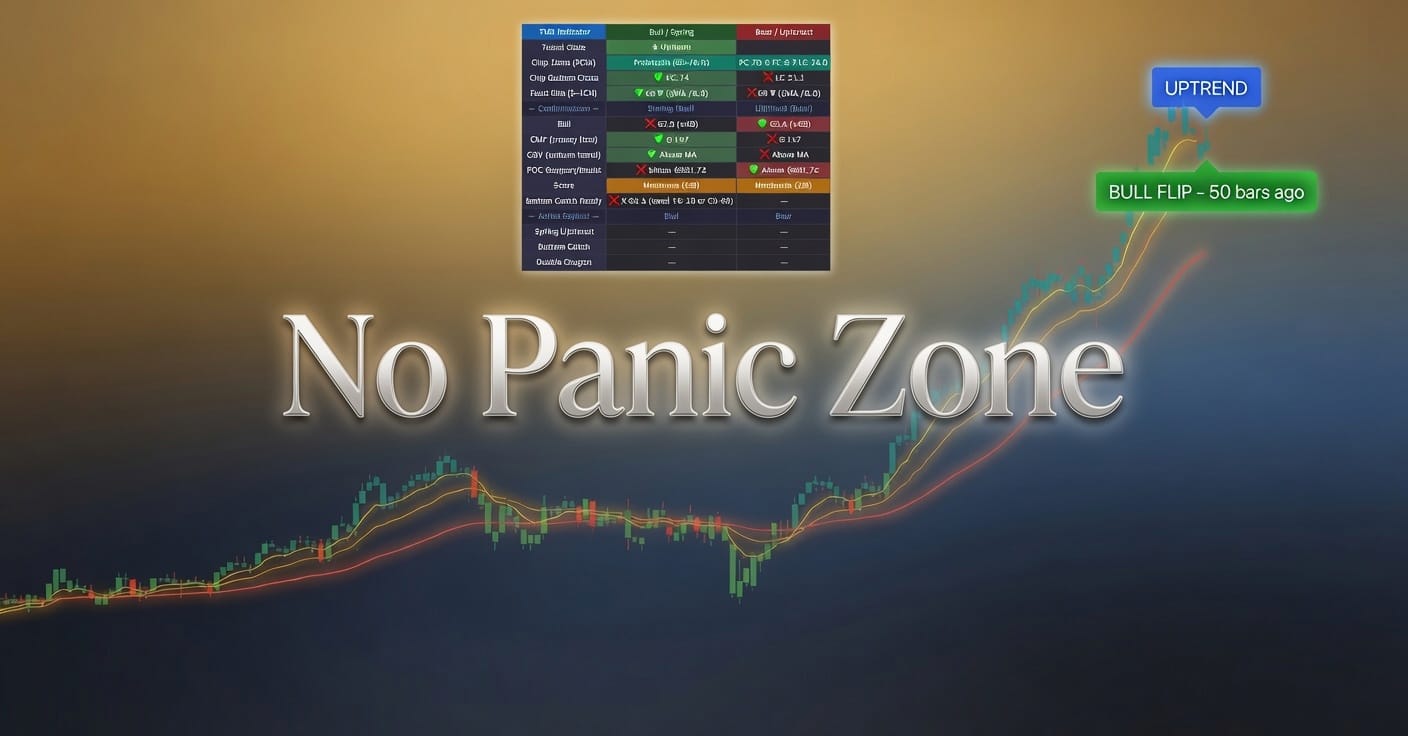
I draw a line on a chart. It does not care what CPI says. The line was there Monday. The line will be there Wednesday. The line has no mortgage and no feelings, which makes it your superior in every measurable way.
You will refresh the release page nine times before 8:31. You will read "shelter" as a personal threat. You will call 0.1% above consensus a "disaster" while your portfolio is down 22% because you bought a dog-themed token from a stranger.
Tuesday's report tells you what prices did in October. October is over. You are trading a number about the past, with money from the future, using confidence from nowhere.
Enjoy the data, champ. It was nice of the government to give you a homework assignment you will still fail.
Photo by Markus Winkler on Unsplash




Leave a Comment