
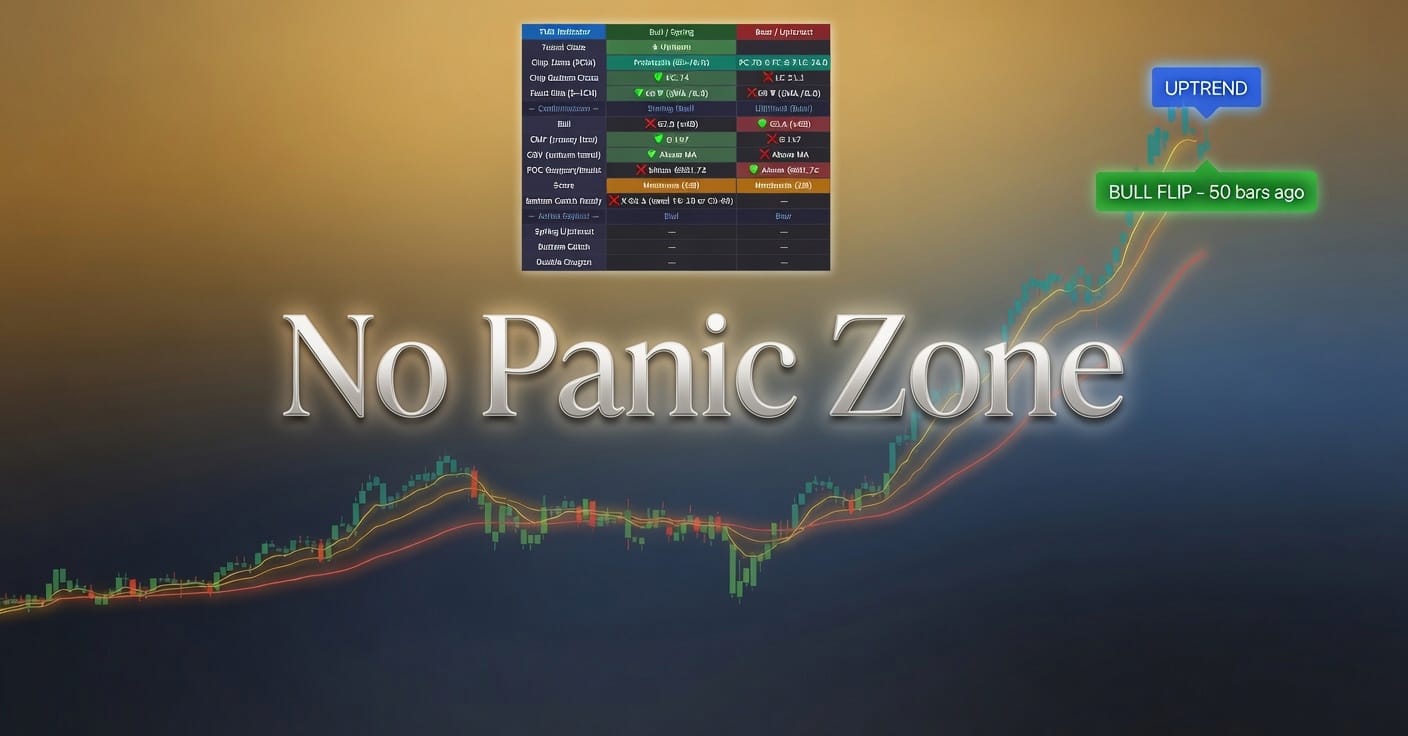
This guide explains every element of the indicator and dashboard
Glossary of Terms
New to the THS Trend Candles system? Start here. These are the core concepts used throughout every analysis on Panic Sell Weekly.
| Term | Definition |
|---|---|
| Trend State & Candle Colors | Every candle on the chart is colored to show the system's trend read. A green candle marks a Bull Flip — the exact bar where the trend just switched from bearish to bullish. A red candle marks a Bear Flip — the exact bar where the trend just switched from bullish to bearish. Dark blue means the chart is in an established Uptrend and this bar is continuing it. Light blue (cyan) means the chart is in an established Downtrend and this bar is continuing it. Green and red only appear on the single bar where the flip actually happens — every bar after that shows as dark blue or light blue until the next flip. |
| Spring | A Wyckoff-based bullish reversal signal. Price briefly dips below a recent support low, flushes out weak sellers, then snaps back above it on a volume spike. The failure to hold below support is the signal — it means sellers are exhausted. Named after a spring being compressed and released. |
| Upthrust | The bearish mirror of a Spring. Price briefly pushes above a recent resistance high, sucks in late buyers, then rejects back below it on a volume spike. The failure to hold above resistance is the signal — it means buyers are exhausted. A warning to reduce or exit longs. |
| Bottom Catch | A reversal signal that fires when four conditions align at once: Stochastic K is in a recovery zone (10-20 or 50-60), price crosses back above EMA 20, the candle closes green, and the close is higher than the previous bar. All four must be true on the same bar. It identifies early-stage recoveries from pullbacks. |
| Double Dragon | A breakout continuation signal. Fires when profitable chips (PC) cross back above 75% with a bullish candle and PC above its own SMA. It means the majority of holders are back in profit and momentum is pointing up — conditions historically associated with continuation moves rather than reversals. |
| Golden Cross (Chips) | When the 5-bar SMA of profitable chips (PC) crosses above the 5-bar SMA of locked chips (LC). Signals a structural bullish shift — more holders are becoming profitable faster than trapped holders are accumulating. The wider the gap, the stronger the structure. |
| Death Cross (Chips) | The bearish mirror of the Golden Cross. LC SMA crosses above PC SMA — trapped holders are growing faster than profitable ones. A structural warning that overhead supply is building. |
| Chips (PC / FC / LC) | Inspired by the MCDX chip distribution system. Divides all holders over the last 100 bars into three groups: PC (profitable — bought below current price), FC (float — actively trading within 3% of current price), and LC (locked — bought above current price, currently underwater). Always adds up to 100%. |
| Fund Simulation | A 0-100 momentum indicator built on a triple EMA of the stochastic RSV, designed to simulate institutional money flow. Above 50 = net bullish momentum. Below 50 = net bearish. The arrow (▲ or ▼) shows whether momentum is accelerating or decelerating relative to its own 5-bar SMA. Above 85-90 with ▲ = very strong conviction. |
| POC (Point of Control) | The price level with the highest volume-weighted activity over the last 100 bars. Think of it as the market's centre of gravity — price tends to be attracted to it and react strongly when it crosses it. Price above POC = POC acts as support. Price below POC = POC acts as resistance. |
| Bottom Catch Ready | A pre-condition tracker, not a signal itself. Shows whether the Stochastic K value is currently in one of the two Bottom Catch recovery zones (10-20 or 50-60). A ✅ means the stochastic condition is met — but the full Bottom Catch signal still requires the EMA 20 cross, green candle, and higher close on the same bar. |
| CMF (Chaikin Money Flow) | Measures whether money is flowing into or out of an asset based on where each candle closes within its range, weighted by volume. Above +0.05 = buying pressure, institutions accumulating. Below -0.05 = selling pressure, institutions distributing. Near zero = neutral, no clear conviction from either side. |
| OBV (On Balance Volume) | Cumulative volume indicator. Adds volume on up days, subtracts on down days. When OBV is above its moving average, buying volume is outpacing selling volume on a cumulative basis — a bullish confirmation. Below MA means selling volume is winning. |
| MA Filters | Two filters that suppress signals when the trend is too strong to expect a reversal. All MAs Aligned suppresses upthrust signals in a strong uptrend and spring signals in a strong downtrend. Strong Trend does the same when EMA 60 has been trending in one direction for 10+ bars. When active, they prevent false reversal signals in trending markets. |
| Confirmation Score | A 0-4 count of how many of the four confirmation indicators (RSI, CMF, OBV, POC) are supporting a Spring or Upthrust signal. Strong = 3-4/4. Moderate = 2/4. Weak = 0-1/4. A signal with a Weak score can still play out — but conviction is lower and risk management matters more. |
| Compression Tier (Squeeze) | Measures whether a bigger-than-usual price move is becoming more likely soon — relative to this specific ticker's own recent history, not a fixed universal threshold. Says nothing about direction on its own. Four tiers: None (nothing unusual building), Mild (the earliest, loosest sign of tightening — not meaningful by itself), Moderate (a real, developing coil worth watching), and Tight (a genuine coil, shown with a bars-count, that historically tends to precede a sharper-than-average move once it resolves). A Tight reading is never a guarantee or a timing promise — just "more likely than usual." Pair it with Momentum below to gauge direction. |
| Momentum | A signed number paired with the Compression Tier that answers which direction the current push is leaning, and whether it's strengthening or weakening. Shown as the number itself, an arrow (▲/▼) versus the prior bar, and a delta showing the exact size of that change. Read the sign and arrow together: positive+rising means bullish and strengthening, positive+falling means bullish but weakening, and the mirror image applies on the negative side. Momentum is a rolling calculation and can lag real price action — it can keep pointing the old direction for several bars after price has already turned, which isn't a contradiction, just how the math works. Never compare raw momentum values between two different tickers — the number scales with each instrument's own price level, so only its own sign, arrow, and delta carry meaning. |
Compression Box Colors
The rectangle drawn directly on the chart marking a Tight compression coil, anchored to the price range where the coil began. Its color tells you the coil's current status. Every resolved box comes out red or green — there's no neutral/undecided outcome, since resolution is always decided by which side of the box's own midpoint price closed on.
| Color | Name | Meaning |
|---|---|---|
| Violet — Active | The coil is still active — compression hasn't fully released yet. This can be true even if price has already started moving and cleared the top or bottom edge of the box; the box stays violet until compression itself drops all the way back to Mild or None. Violet now means one thing only: still active. Once a box resolves, it's always red or green. | |
| Green — Resolved Bullish | Compression fully released, and price closed above the box's midpoint. A confirmed, already-happened directional break to the upside. | |
| Red — Resolved Bearish | Compression fully released, and price closed at or below the box's midpoint. A confirmed, already-happened directional break to the downside. |
Candle Colors
| Color | Name | Meaning |
|---|---|---|
| 🟢 Green | Bull Flip | Trend turning bullish — price crossed above both MAs with MAs sloping up. Strong buy signal. |
| 🔴 Red | Bear Flip | Trend turning bearish — price crossed below both MAs with MAs sloping down. Warning/reduce signal. |
| 🔵 Dark Blue | Uptrend Continuation | Trend confirmed bullish. Hold or add to positions. |
| 🩵 Light Blue | Downtrend Continuation | Trend confirmed bearish. Caution or short. |
Moving Averages
Three EMAs plotted on the chart:
| Line | Period | Color | Purpose |
|---|---|---|---|
| Short MA | EMA 8 | Yellow | Short term trend direction |
| Medium MA | EMA 20 | Orange | Medium term trend, used for Bottom Catch cross |
| Long MA | EMA 60 | Red | Long term trend, defines strong uptrend/downtrend |
Chart Labels
| Label | Color | Meaning |
|---|---|---|
| G/C | Purple | Golden Cross — profitable chip SMA crossed above locked chip SMA. Bullish structural shift. |
| D/C | Dark/Grey | Death Cross — profitable chip SMA crossed below locked chip SMA. Bearish structural shift. |
| D/D | Orange | Double Dragon — chips crossed back above 75% with a bullish candle. Breakout continuation signal. |
| ↑75 | Green | Chips reclaimed 75% level — profitable holders back in majority. |
| ↓75 | Orange | Chips dropped below 75% — Double Dragon reset, watch for potential pullback. |
| B/C | Blue | Bottom Catch — Stochastic K in recovery zone + price crossed EMA 20 + green candle. Reversal signal. |
| ▲ | Blue | Spring signal — price pierced below recent range low then recovered with volume spike. |
| ▽ | Orange | Upthrust signal — price pierced above recent range high then rejected with volume spike. |
Dashboard — Row by Row
Trend State
Current candle color state. ▲ Uptrend (dark blue candles) or ▼ Downtrend (light blue candles).
Chip Zone (PC%)
Inspired by MCDX chip distribution from Tonghuashun
Measures what percentage of holders over the lookback period are currently profitable based on price position in the range. Three values are shown in the format PC:52.3 FC:7.7 LC:40.0:
| Value | Name | Meaning |
|---|---|---|
| PC | Profitable Chips | % of holders who bought below current price — in profit |
| FC | Float Chips | % of holders actively trading near current price (±3% band around close) |
| LC | Locked Chips | % of holders who bought above current price — underwater/trapped |
PC + FC + LC always = 100%
Zone levels:
| Zone | PC% | Meaning |
|---|---|---|
| Profitable (>75%) | >75% | Most holders profitable — bullish, potential Double Dragon zone |
| Profitable (50-75%) | 50-75% | Majority profitable — healthy uptrend |
| Accumulation (25-50%) | 25-50% | Mixed — transitional zone, watch for direction |
| Oversold (<25%) | <25% | Most holders trapped — potential reversal/capitulation zone |
Reading the chip values:
- High PC + Low LC = strong bullish chip structure, most holders in profit
- Low PC + High LC = bearish chip structure, most holders trapped
- High FC = lots of active trading near current price, indecision zone
- Low FC = holders have made up their minds — either comfortably profitable or clearly trapped
Chip Golden Cross
Compares the 5-bar SMA of PC vs LC:
- ✅ Bull (PC SMA > LC SMA) = Golden Cross — profitable chips trending above locked chips. Bullish.
- ✅ Bear (LC SMA > PC SMA) = Death Cross — locked chips trending above profitable chips. Bearish.
Shows actual SMA values: ✅ PC 68.7 vs ❌ LC 23.5
Fund Simulation (0-100)
A triple EMA of the stochastic RSV that simulates institutional/smart money momentum.
| Value | Meaning |
|---|---|
| >75 | Strongly bullish institutional momentum |
| 50-75 | Moderately bullish |
| 50 | Neutral midline |
| 25-50 | Moderately bearish |
| <25 | Strongly bearish — potential capitulation |
▲ = Fund Sim rising above its own 5-bar SMA (momentum accelerating) ▼ = Fund Sim falling below its own 5-bar SMA (momentum decelerating)
Shows value and SMA: ✅ 83.6 ▲ (SMA 68.2)
Confirmations Section
These four indicators score whether a Spring (bull reversal) or Upthrust (bear reversal) signal is high quality. Each shows the actual value alongside the checkmark so you can see the number directly.
RSI (Relative Strength Index)
Measures momentum on a 0-100 scale.
- Spring ✅ = RSI below 40 (oversold) — supports a bounce. Shows: ✅ 32.7 (<40)
- Upthrust ✅ = RSI above 60 (overbought) — supports a top. Shows: ✅ 76.7 (>60)
CMF (Chaikin Money Flow)
Measures whether money is flowing into or out of the asset based on where candles close within their range weighted by volume.
- Spring ✅ = CMF > 0.05 (money flowing in). Shows: ✅ 0.154
- Upthrust ✅ = CMF < -0.05 (money flowing out). Shows: ✅ -0.106
- Positive = buying pressure, institutions accumulating
- Negative = selling pressure, institutions distributing
OBV (On Balance Volume)
Tracks cumulative volume direction — adds volume on up days, subtracts on down days.
- Spring ✅ = OBV above its 20-bar MA and rising. Shows: ✅ Above MA
- Upthrust ✅ = OBV below its 20-bar MA and falling. Shows: ✅ Below MA
POC Support/Resist (Point of Control)
The price level with the highest volume-weighted activity over the last 100 bars. Acts as a magnet for price.
- Spring ✅ = Price is near or below POC (potential support bounce). Shows: ✅ Near/Below $1,844
- Upthrust ✅ = Price is near or above POC (potential resistance rejection). Shows: ✅ Near/Above $1,844
Score
Total confirmation count out of 4:
| Score | Label | Meaning |
|---|---|---|
| 3-4/4 | Strong | High conviction signal |
| 2/4 | Moderate | Watch for follow through |
| 0-1/4 | Weak | Low conviction, use caution |
Bottom Catch Ready
Tracks the Stochastic K value to see if it is in a recovery zone.
Zones that matter:
| Zone | Meaning |
|---|---|
| K 10-20 | Deep oversold — capitulation low forming |
| K 50-60 | Mid pullback recovery — healthy continuation |
- ✅ K in zone (current bar): ✅ K:18.4 in zone
- ✅ K in zone (previous bar triggered): ✅ K:22.1 prev:17.8 in zone
- ❌ K out of zone: ❌ K:75.6 (need 10-20 or 50-60)
Note: Bottom Catch Ready being ✅ does not mean the signal has fired — it means the Stochastic condition is met. The full Bottom Catch signal also requires a green candle crossing above the EMA 20.
Active Signals
Spring / Upthrust
Wyckoff-inspired reversal signals based on volume spikes through recent range extremes:
| Signal | Meaning |
|---|---|
| 🔵 Strong | Spring/Upthrust + 3-4 confirmations — high conviction reversal |
| 💙 Moderate | Spring/Upthrust + 2 confirmations — watch for follow through |
| ○ Basic | Spring/Upthrust + 0-1 confirmations — low conviction |
| — | No signal firing this bar |
Bottom Catch
✅ = All conditions met this bar: K in zone + EMA 20 cross + green candle + close higher than previous
Double Dragon
✅ = Chips crossed back above 75% with a bullish candle and PC above its SMA. Breakout continuation.
Last Signals
Shows when each signal last fired and how many bars ago — color coded by recency so you can instantly judge whether a signal is still relevant.
| Display | Color | Meaning |
|---|---|---|
| 🔥 This bar | Orange | Signal firing right now |
| ✅ 3 bars ago | Green | Fired within last 5 bars — still very relevant |
| ⚠️ 10 bars ago | Orange | Fired 6-15 bars ago — recently fired, context still useful |
| 🔘 28 bars ago | Grey | Fired more than 15 bars ago — historical reference only |
| — | Dark | Signal has never fired in this chart session |
Rows tracked:
- Last Spring — most recent spring signal
- Last Bot Catch — most recent Bottom Catch signal
- Last Dbl Dragon — most recent Double Dragon signal
MA Filters
These filters can suppress Spring or Upthrust signals when the trend is too strong in one direction to expect a reversal.
All MAs Aligned
- Suppresses Upthrust (bull column ✅) = All 3 MAs pointing up, price above all — too bullish to expect a top
- Suppresses Spring (bear column ✅) = All 3 MAs pointing down, price below all — too bearish to expect a bounce
Strong Trend
- Suppresses Upthrust (bull column ✅) = EMA 60 has been rising for 10+ bars — confirmed strong uptrend
- Suppresses Spring (bear column ✅) = EMA 60 has been falling for 10+ bars — confirmed strong downtrend
When orange: a filter is active and blocking signals in that direction.
POC Level
The Point of Control — highest volume price level over the last 100 bars.
- Price Above POC = bullish (POC acts as support below price)
- Price Below POC = bearish (POC acts as resistance above price)
Reading the Dashboard Together
Ideal Bull Setup:
- Trend State: ▲ Uptrend
- Chip Zone: Accumulation or Profitable, PC rising
- Golden Cross: ✅ bull, PC SMA above LC SMA
- Fund Sim: >50 ▲ rising
- RSI: oversold recovering (<40)
- CMF: positive (>0.05)
- OBV: above MA
- Score: Strong 3-4/4
- Bottom Catch Ready: ✅ K in zone
- Last Bot Catch: recently fired (green)
- MA Filters: neither suppressing spring
Ideal Bear Setup:
- Trend State: ▼ Downtrend
- Chip Zone: Oversold, PC falling, LC dominant
- Golden Cross: ✅ bear (Death Cross), LC SMA above PC SMA
- Fund Sim: <50 ▼ falling
- RSI: overbought (>60)
- CMF: negative (<-0.05)
- OBV: below MA
- Score: Strong 3-4/4 upthrust
- MA Filters: neither suppressing upthrust
This is not financial advice. Always manage risk appropriately and never risk more than you can afford to lose.
This guide explains every element of the indicator and dashboard.






Leave a Comment