

Katie Stockton looked at retail stocks. She saw some lines. The lines told her a counter-trend rally might happen. She shared this information with people who pay for information about lines.
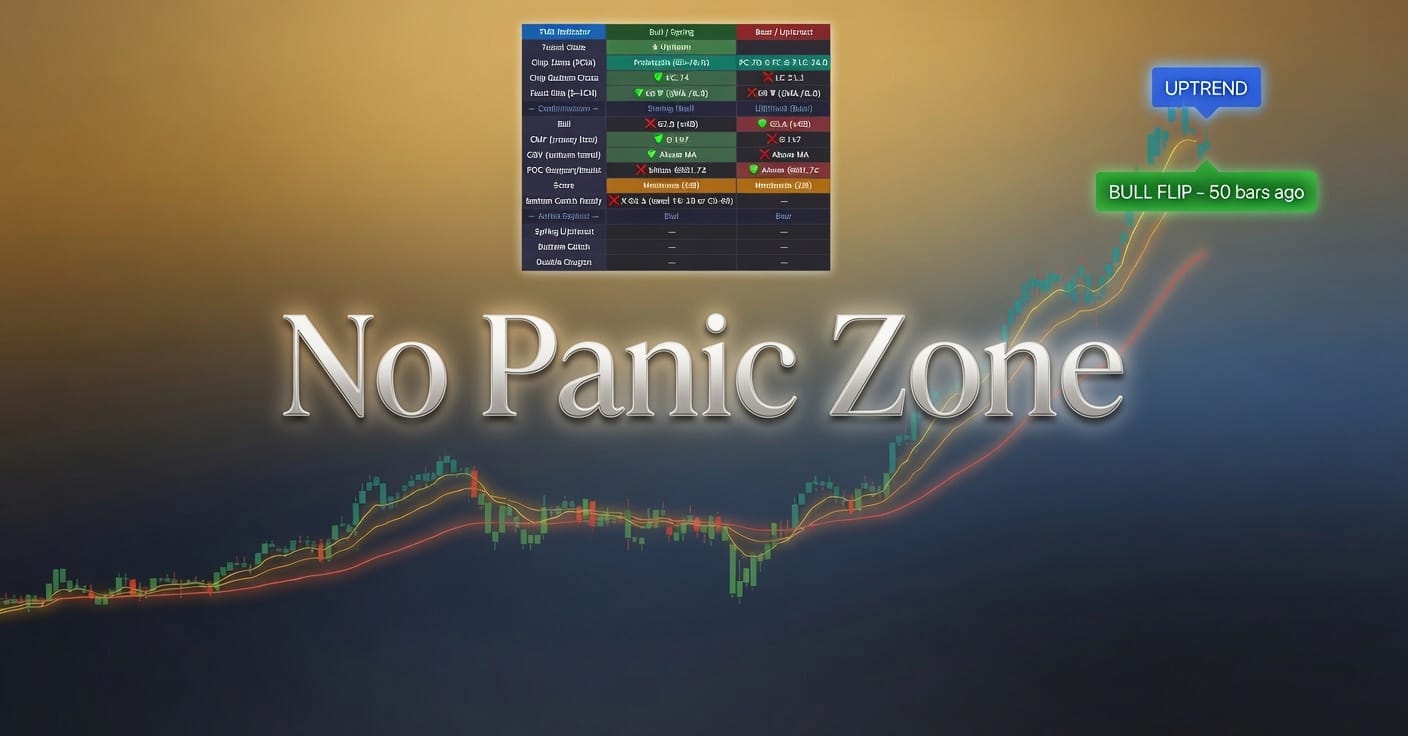
Technical analysis works like this: you draw lines on a chart until the lines tell you what you already wanted to hear. Then you tell everyone the lines are speaking. The lines always speak eventually. They're very accommodating that way.
Retail stocks corrected recently, which means they went down, which means people who bought them lost money, which means those people are now stabilizing their expectations about their ability to pick stocks. Stockton says this stabilization could prime a bounce. She did not specify which stocks. She said "these stocks" like you're supposed to already know. You don't know. Nobody knows. That's the whole f*cking point.
Counter-trend rally is a term that means the stock might go up even though it's been going down. It might also keep going down. Technical analysts invented this term so they could be right either way. If it goes up, they called the counter-trend rally. If it keeps going down, the counter-trend rally just hasn't started yet. The lines need more time to speak.
Retail traders will see this headline and think Katie Stockton has information they don't have. She doesn't. She has the same chart you have. She just drew different lines on it. Your lines are equally valid. Her lines went to better schools.
The stocks may lead the bounce, or they may lead you directly into another margin call while Stockton draws new lines explaining why the old lines were actually pointing down the whole time if you squint.
Photo by Tötös Ádám on Unsplash





Leave a Comment