

Mastercard stock closed at an all-time high yesterday. Eight straight days of gains. The charts say more upside ahead.
Technical analysts love this setup. A sustained move with clean price action. No pullbacks. No hesitation. Just a straight line up that makes every retail trader feel like a genius for exactly three days before they panic-sell at the first 2% dip.
The moving averages crossed bullish last week. RSI shows momentum without being overbought. Volume confirms the move. Every textbook signal says buy. Which means approximately 400,000 amateur traders just opened Robinhood accounts to chase a credit card company that's already up 8% in eight sessions.
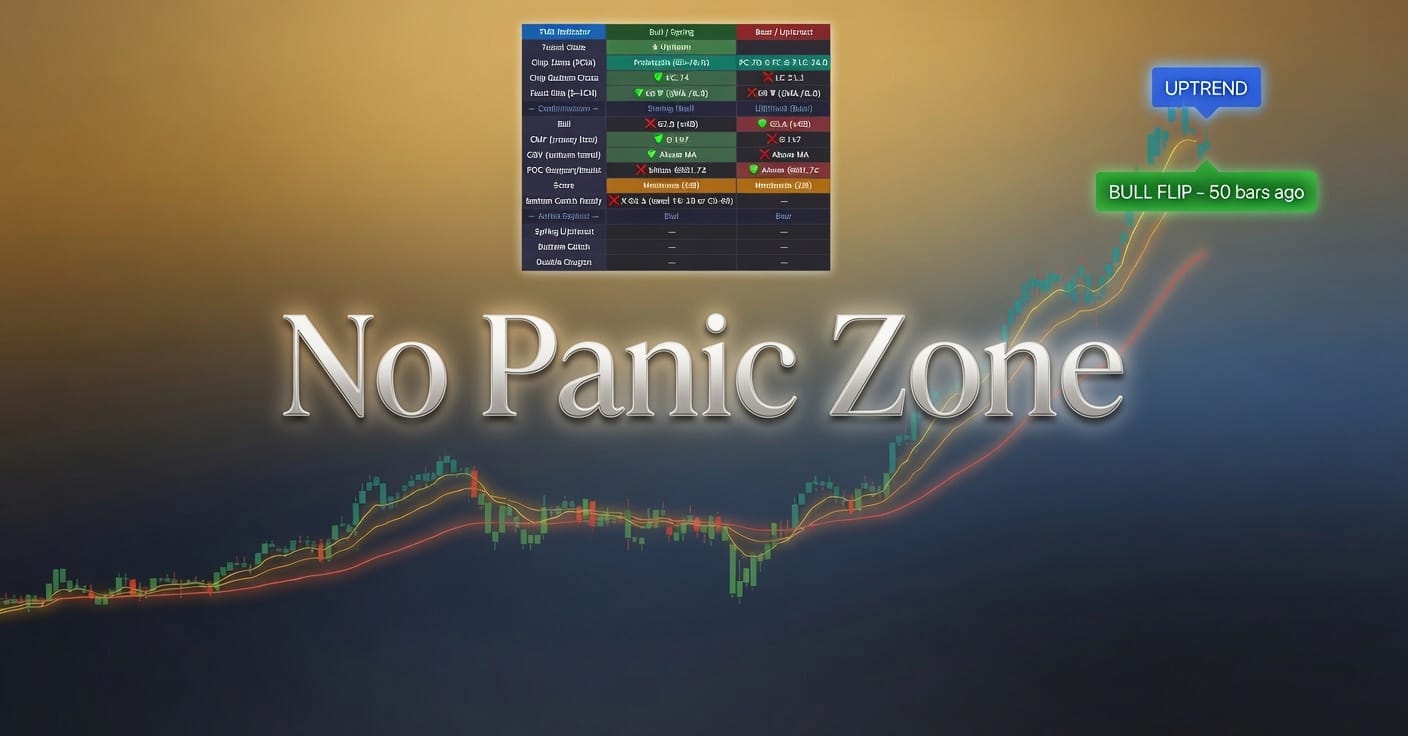
Here's what the charts actually indicate: Mastercard will keep running until it doesn't. The breakout looks strong until support fails. The trend remains intact until it reverses. This is technical analysis. We draw lines on screens and pretend the lines predict the future.
But the setup is clean. Price above all major moving averages. Higher lows. Higher highs. The kind of chart pattern that gets posted in Discord servers with rocket emojis and the word MOON in all caps.
The smart money bought six months ago when the stock was consolidating and boring. The dumb money buys today after reading a headline about an eight-day win streak. Then they'll hold through a 15% correction while telling themselves they're long-term investors who don't care about short-term volatility.
The resistance level that held for six weeks just became support. That's legitimately bullish. The breakout has room to run. Maybe another 5% before the first test. Maybe more if the broader market cooperates.
None of this matters if you're buying at an all-time high because a summary told you the run isn't over.




Leave a Comment