
THS Trend Candles System | Weekly | September 29, 2026
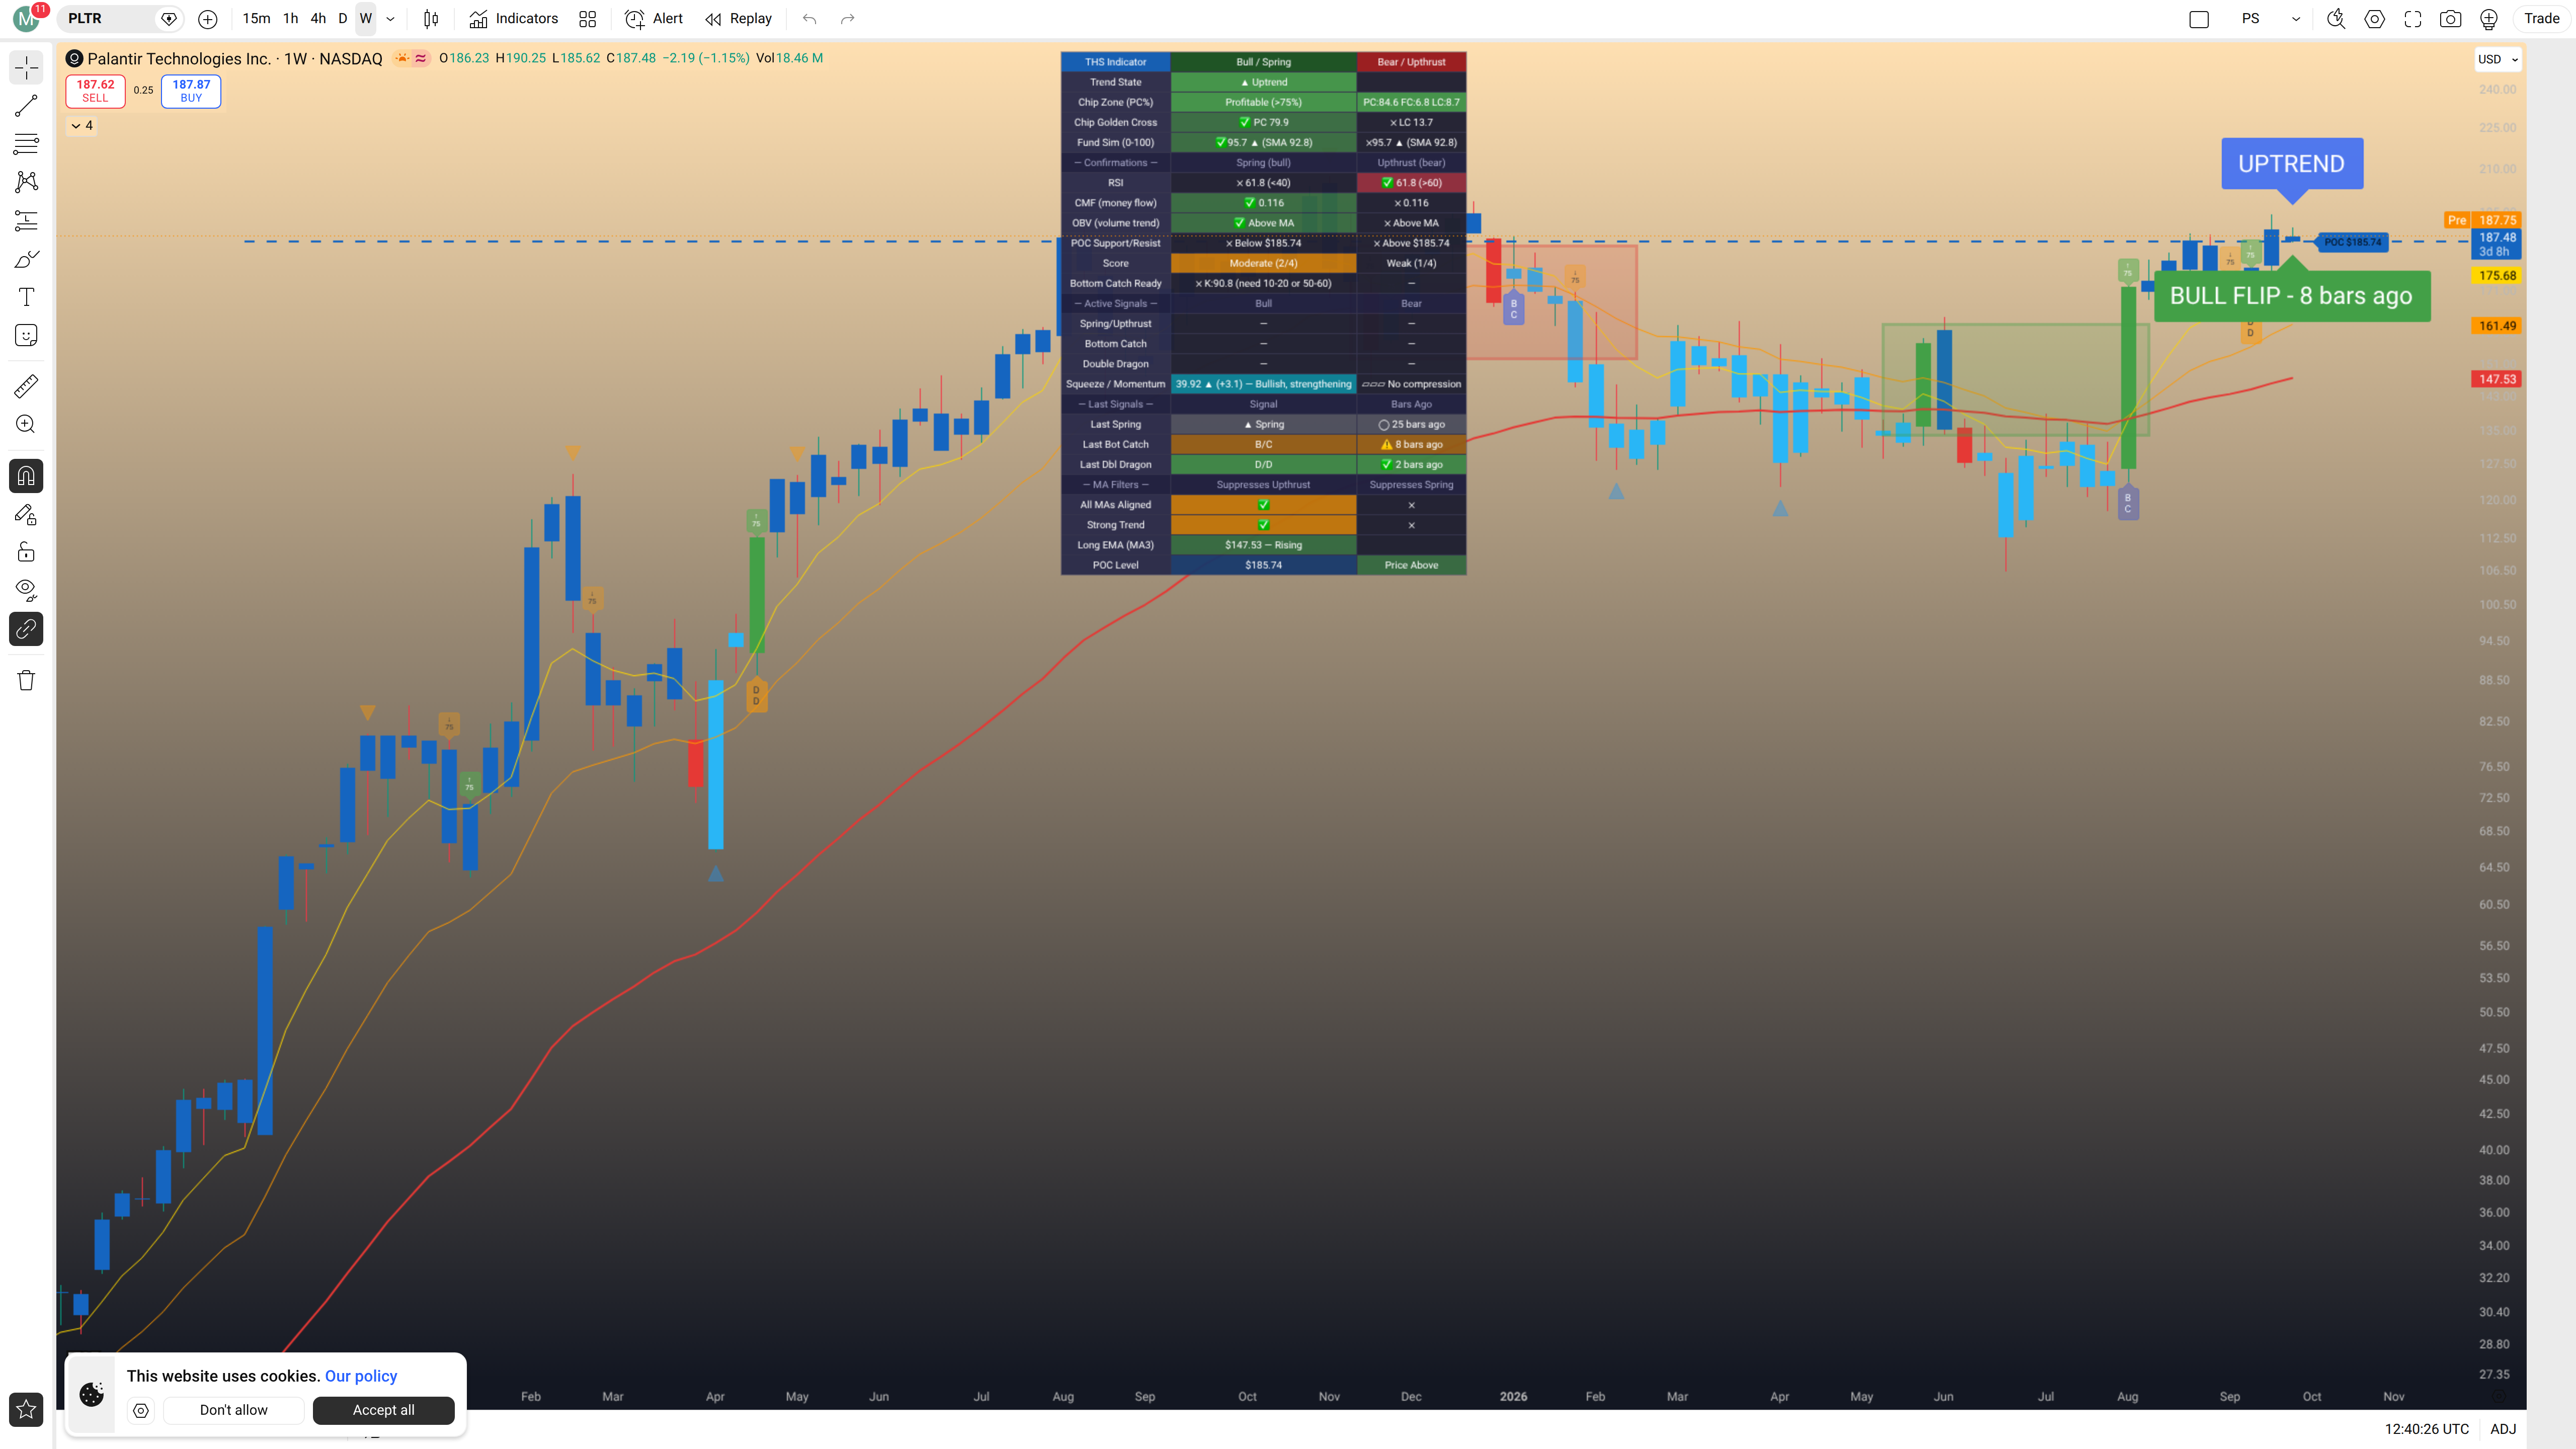
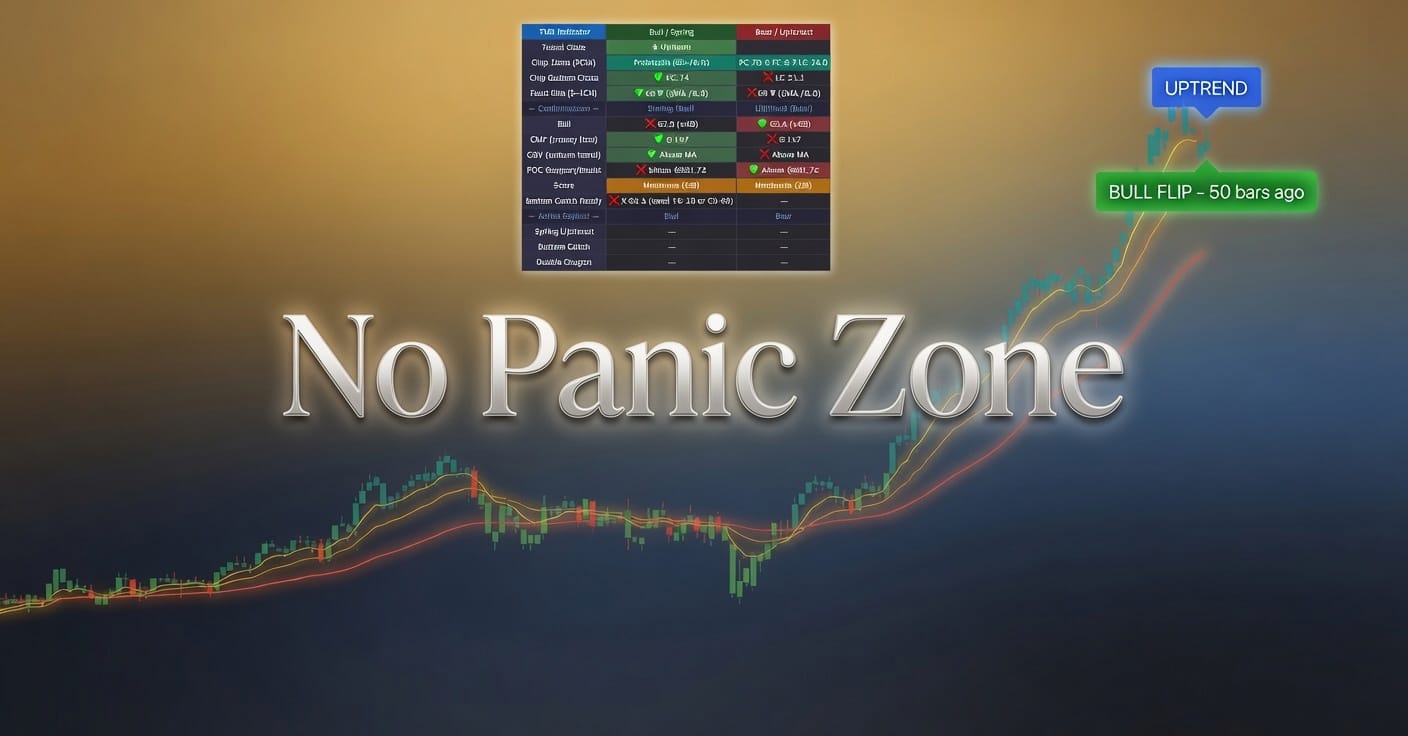
Don't worry about squinting at the small dashboard in the chart image above — every reading from it is broken out clearly in the summary table below.
Plain English
PLTR leans bullish over the coming weeks — the uptrend that flipped eight weeks ago is holding firm, the squeeze that built through mid-year has been resolving to the upside with strengthening momentum, and the chip distribution has tilted decisively in favor of holders in profit, all of which points toward further upside being more likely than not at current levels; for existing holders, this remains a hold, and for those watching from the sidelines, a pullback toward the $185–$177 range would offer a reasonable spot to consider building a position. Palantir Technologies is an AI and data analytics platform company — it builds software that helps governments and large enterprises make sense of complex data and decisions at scale, and its chart has been on a sustained run, climbing from the low teens in late 2024 to nearly $190 today on the back of strong institutional interest and improving fundamentals. The momentum reading is positive and still rising, the Long EMA is rising and price sits well above it, and the Fund Sim is at an elevated 95.7 — conditions that together describe a stock in genuine demand, not just drifting higher. This Weekly candle is provisional and has not closed yet — any of these readings, including the candle's color and the OHLC values, could still change before the week's close. Last time out on September 25, 2026, the call was still technically a Bull Flip with the POC holding at $177.21 — price has since pushed further into the $185–$190 range, validating that read.
Snapshot & Big Picture
Palantir Technologies Inc. is an AI-driven data analytics and software platform company serving government agencies and large commercial enterprises globally. The weekly chart has been in a strong, sustained uptrend since the Bull Flip fired eight weeks ago, with price climbing steadily from the mid-$170s into the high $180s and briefly touching $190.25 this week. The governing signal is an established Uptrend continuation — Bull Flip 8 weeks ago — and this week's candle is currently showing as a dark blue continuation bar, though that is provisional until the weekly close. This week, PLTR has opened at $186.23, reached a high so far of $190.25, dipped to a low of $185.62, and is currently trading near $187.48 — a range that reflects ongoing demand with a modest intraweek pullback from the high. This candle is provisional and has not closed yet — any of these readings, including the candle color and all OHLC values, could still change before Friday's close. In the prior covered analysis from September 25, 2026, the trend was still a Bull Flip with the POC at $177.21 — price has since extended meaningfully above that level, continuing to confirm the bullish thesis.
| Factor | Reading | Signal |
|---|---|---|
| Prior Coverage | Sep 25, 2026 — Bull Flip 7 weeks ago, POC $177.21 | |
| Trend State | Bull Flip — 8 weeks ago (Uptrend continuation, provisional) | |
| Chip Zone (PC/FC/LC) | Profitable (>75%) — PC 84.6 / FC 6.8 / LC 8.7 (Bear column); Bull column: PC 79.9 | |
| Golden Cross | PC SMA 79.9 ✓ (Bull) vs LC SMA 13.7 ✗ | |
| Fund Sim (0–100) | 95.7 ▲, SMA 92.8 — above its own average | |
| RSI | 61.8 — above 60, Upthrust (bear) confirmation checked | |
| CMF (Money Flow) | 0.116 — Above MA (Bull confirmed) | |
| OBV (Volume Trend) | Above MA (Bull confirmed) | |
| POC Support/Resist | $185.74 — Price currently below POC | |
| Bull Score / Bear Score | Bull: Moderate (2/4) | Bear: Weak (1/4) | |
| Bottom Catch Ready | K: 90.8 — Not ready (needs 10–20 or 50–60) | |
| MA Filters | All MAs Aligned: Bull ✓ / Strong Trend: Bull ✓ | |
| Squeeze / Momentum | No compression | Momentum: 39.92 ▲ (+3.1) — Bullish, strengthening | |
| Long EMA (MA3) | $147.53 — Rising |
What the Chips Are Telling Us
- Profitable Chips (PC): 84.6% — the vast majority of the price-volume distribution is sitting in profit at current price levels
- Float Chips (FC): 6.8% — a relatively thin band of active supply trading right around current price, meaning there isn't a heavy liquid overhang pressing down from nearby sellers
- Locked Chips (LC): 8.7% — a small but present pocket of holders sitting at a loss, likely to act as modest overhead resistance as they look to exit near breakeven on any further push
At 84.6% Profitable Chips, PLTR is deep in what this system classifies as a Profitable (>75%) chip zone — meaning most of the volume that has ever changed hands in this name is currently in the green. That's a meaningful structural signal: it tells you that sellers don't have a lot of pain-based motivation to sell, because most of them are already holding a winner. The Float Chips reading of 6.8% shows relatively thin active supply near current price, which means there isn't a dense cluster of recently traded shares sitting right overhead ready to create friction on the next move up. The combination of high PC, low FC, and low LC is the kind of distribution that tends to support trending behavior rather than choppy sideways price action.
The Golden Cross check confirms the bullish lean here: the PC SMA is running at 79.9 — comfortably above the 75% threshold this system uses to define a confirmed Golden Cross on the chip side — while the LC SMA sits at 13.7. That spread between the profitable average and the locked average is wide, and it reinforces that the chip distribution has tilted structurally in favor of the upside. The 8.7% LC still represents a real, if modest, pocket of overhead supply — holders who bought higher and are waiting to recoup losses — but at that size it's more of a speed bump than a wall. The prior POC from the last covered post sat at $177.21; price has pushed well above that level since then, and the current POC has reset to $185.74, reflecting that the center of gravity for trading volume has shifted higher over the past several weeks as the uptrend has continued to extend.
Fund Simulation
Institutional Confidence at Elevated Levels
The Fund Sim is currently reading 95.7, with an upward arrow, running above its own SMA of 92.8. This metric attempts to simulate how a large institutional player would be positioned in this name based on the overall weight of the system's signals — and at 95.7, it's saying that a simulated fund would be near-fully invested in PLTR at current levels. The fact that it's sitting above its own 92.8 SMA means the reading isn't just high in absolute terms; it's trending upward relative to its own baseline, which is an additional layer of confirmation that institutional-style demand has been building rather than fading.
In the prior coverage from September 25, 2026, the Fund Sim was reading 94.7 against a SMA of 93.0 — so week-over-week the reading has ticked up slightly (from 94.7 to 95.7), and it has remained above its SMA throughout. That consistency matters: a Fund Sim that dips back below its SMA is an early warning sign that the institutional conviction behind a move is starting to waver. Right now, there's no sign of that. The continued expansion above the SMA, even if modest, confirms that the underlying conditions driving this uptrend haven't materially deteriorated since the last post.
Confirmations
A Mixed But Net-Bullish Confirmation Picture
RSI: The RSI is currently reading 61.8. In this system's framework, an RSI above 60 is what's needed to confirm an Upthrust (bear) signal — and at 61.8, it is technically checking that box on the bear-confirmation side, which sounds paradoxical. What it actually means is that PLTR is running in the upper-momentum range, which both bullish trend continuation and potential overbought-reversal setups can share. For the Spring (bull) confirmation, the system needs RSI below 40 — so that check is unmet, and that's expected and normal for a stock that has already flipped and been trending higher for two months. The RSI at 61.8 is not a red flag; it's a reflection of the trend's strength, though it does mean there's less room overhead before overbought readings start to factor in.
CMF (Money Flow): 0.116 — comfortably above the 0.10 threshold this system treats as genuine accumulation territory, and above its own MA. A CMF above 0.05 is enough to confirm a Spring signal; above 0.10 indicates real institutional buying pressure, not just a marginal positive reading. At 0.116, the money flow story is firmly in the bullish column, matching what the chip distribution is already suggesting about structural demand. Both the bull and bear confirmation frameworks see 0.116 as relevant — it's above the MA on both checks — but it is unambiguously net-bullish in this context.
OBV (Volume Trend): Above its MA on the bull side — a straightforward confirmation that volume is trending in the right direction relative to price. When OBV stays above its MA during a rising trend, it tells you that the up-days are attracting more volume than the down-days, which is the kind of participation that gives an uptrend structural credibility rather than looking like a low-conviction drift.
POC Support/Resist: The Point of Control is currently at $185.74, and the current price of $187.48 is sitting modestly above it. However, the dashboard's POC Support/Resist row shows the price as currently below the POC — likely reflecting the live, intraweek positioning as price oscillates around this key level mid-week. The POC at $185.74 is meaningfully higher than the prior coverage POC of $177.21, confirming that the center of volume distribution has migrated higher as the trend has extended. Whether price closes the week cleanly above $185.74 will matter: a confirmed weekly close above the POC keeps it as support; slipping back below it and failing to reclaim it would be an early flag worth watching.
Bull Score / Bear Score: The Bull Score sits at Moderate (2/4) and the Bear Score at Weak (1/4). This is an honest picture of where the confirmation scorecard lands: the uptrend is real and the weight of evidence leans bullish, but this isn't a picture-perfect full-confirmation setup on the bull side. CMF and OBV are contributing to the bull score; RSI at 61.8 is contributing to the bear score's Upthrust check. The net message is a trend that's intact and leaning bullish without being in a screaming maximum-conviction configuration — which is typical for a trend that has already been running for eight weeks.
Bottom Catch Ready: ❌ K: 90.8 — not in zone. The Bottom Catch setup requires the Stochastic K to be in the 10–20 range (deep oversold) or the 50–60 range (mid-cycle reset). At 90.8, K is running near overbought territory — the opposite of where a Bottom Catch fires. This is not a concern for existing trend followers; it simply means there's no fresh cycle reset entry available right now, and the next opportunity for a Bottom Catch entry would require a meaningful pullback first.
Squeeze & Momentum: The compression tier is reading No compression — there is no unusual tightening of volatility building at this moment, and no coiled-spring setup to call out. What this week's picture shows is simply an ongoing trend operating in an uncompressed, normal-volatility state. The momentum column tells the more interesting story: momentum is reading 39.92, with an upward arrow and a delta of +3.1 versus the prior bar. The reading is positive and moving away from zero (upward), which per this system's framework is a bullish-strengthening condition — the indicator's own label confirms "Bullish, strengthening," and that checks out independently: a positive reading rising further away from zero is textbook bullish acceleration. The delta of +3.1 is a decent-sized step relative to the magnitude of recent readings, meaning this isn't a case of the arrow technically pointing up but barely moving — the momentum is adding real incremental push. In the prior coverage from September 25, the momentum was reading 36.83 — so over the past week it has grown to 39.92, a meaningful extension in the same bullish direction. Taken together, No compression and strengthening positive momentum describe an uptrend that is accelerating cleanly rather than compressing toward a potential breakout — the move is happening now, not building in anticipation.
Last Signals
Spring, Bottom Catch, and Double Dragon — All Still Active
- Last Spring: ▲ Spring — 25 bars ago (~6 months ago). The Spring signal fired roughly half a year back, marking the original accumulation-to-uptrend transition. At 25 weeks out, it is the oldest of the three active signals but remains the foundational event that set this entire trend in motion.
- Last Bottom Catch (B/C): ⚠️ B/C — 8 bars ago (~2 months ago). The Bottom Catch fired 8 weeks ago, which lines up precisely with the Bull Flip that kicked off the current uptrend phase. This signal was a timely entry confirmation right at the trend transition — a B/C firing within a bar or two of a Bull Flip is a particularly high-conviction setup, and here they essentially coincided.
- Last Double Dragon (D/D): ✅ D/D — 2 bars ago (~2 weeks ago). The Double Dragon signal is the freshest of the three, having fired just 2 weeks ago. A Double Dragon firing within an ongoing uptrend signals a renewed burst of momentum — it's a confirmation that the trend isn't just drifting higher on fumes but has seen a fresh wave of buying that triggered the signal again. A green checkmark emoji on a 2-bar-old Double Dragon means this is a very recent, still-active signal with recency weight behind it.
The signal stack here is strong. The governing structure is a Bull Flip that fired 8 weeks ago, confirmed at the time by a Bottom Catch, and now refreshed just 2 weeks ago by a Double Dragon — meaning the trend has not only held but has generated a second-wave momentum confirmation. Stacked signals of this kind — a Spring establishing the base, a B/C marking the flip, and a D/D reconfirming momentum weeks later — are the kind of sequential signal alignment this system is designed to surface. The Double Dragon at 2 bars ago is the one to watch most closely from here: if momentum continues to extend and price holds its structure, this signal has real staying power for the near-term continuation case.
MA Filters
Full Alignment — All MAs and Long EMA Pointing the Same Direction
Reading the four boolean values directly from the dashboard: All MAs Aligned — Bull: ✅, Bear: ✗. Strong Trend — Bull: ✅, Bear: ✗. Both checks are fully bullish with no divergence between the fast-moving and slow-moving measures. All MAs Aligned means the short, medium, and long moving averages are all positioned in agreement with price above them, with the shorter MAs actively sloping upward — this is a fast-reacting check, and the fact that it remains fully bullish tells you the short-term moving average structure hasn't cracked despite the trend being eight weeks old. Strong Trend — which looks only at whether price is above the Long EMA and whether that Long EMA itself is still sloping upward — also checks fully bullish. The Long EMA (MA3) is currently reading $147.53 with a Rising slope, and with current price around $187.48, PLTR is sitting roughly $40 above its long-term moving average — a substantial cushion. That gap also makes the Long EMA a distant support rather than an immediately relevant level to watch on the weekly chart.
When All MAs Aligned and Strong Trend both read fully bullish simultaneously — as they do here — it means the fast structure and slow structure are completely in sync, which is the cleanest possible MA filter configuration this system can produce. There is no fast-slow divergence to navigate, no lagging measure pointing a different direction from the leaders. The entire moving average stack is pointing in the same direction as the trend, which gives the overall uptrend additional credibility beyond what the price level and candle color alone would suggest.
Signal & Action
Active Uptrend — Hold and Watch for Pullback Entries
The overall posture is actively bullish: an eight-week-old uptrend with a fresh Double Dragon 2 weeks ago, full MA alignment, strengthening positive momentum, and solid CMF and OBV confirmation. In the prior coverage from September 25, 2026, the stated entry condition was a weekly close holding above the $177.21 POC with CMF positive and trend state showing dark blue — all three of those conditions have been met and the trade has worked, with price now trading in the $185–$190 range well above that prior POC.
For Existing Holders
The trend is intact and the signal stack is healthy — there is no structural reason to exit or meaningfully trim at this stage. A fresh Double Dragon 2 weeks ago is actually a reason to give the position room rather than tighten the leash. The key things to monitor going into the week's close: whether price can close back above the $185.74 POC (currently sitting just below it mid-week), whether CMF holds above 0.10 as the week progresses, and whether momentum continues its upward trajectory in next week's reading.
- Hold trigger: Continue holding while price maintains weekly closes above the POC ($185.74) and MA structure stays fully aligned.
- Trim trigger: Consider taking partial profits if price approaches the $200–$210 resistance zone (prior swing high / LC overhead) without a momentum confirmation of continuation.
- Stop trail: Trail the stop toward $175.68 — see Stop Loss section for full detail.
- Watch: POC reclaim on weekly close, Double Dragon follow-through, and next week's momentum delta.
For New Entries
With price elevated and Stochastic K at 90.8 (near overbought), chasing here carries more risk than entering on a pullback — the better opportunity is to let the stock come to you.
- First entry (33%): On a pullback to the $185.74 POC with a confirmed weekly close above it — this is the first and most logical entry point if the market pulls back and holds the POC as support.
- Second entry (33%): On a deeper retest of the $177–$180 zone (prior swing high / prior POC area) with CMF remaining positive — this would represent a more meaningful reset and a higher-conviction add opportunity.
- Third entry (34%): If the first two entries are triggered and the trend continues to hold, add the final tranche on confirmation of a new weekly high above $190.25 with momentum still positive and strengthening.
Stop Loss
The structural stop sits at $175.68, set just below the $177.21 POC level from the prior coverage, which represents the prior key support shelf that the uptrend had been building above. A weekly close below $175.68 would mean price has broken back through that prior POC and is at risk of unwinding the trend; that is the clean structural invalidation level. The Long EMA (MA3) is currently reading $147.53 with a Rising slope — well below current price and far enough away that it serves as a deep-backstop reference rather than a near-term stop consideration. Using it as a stop here would mean accepting a drawdown of roughly $40 from current price, which is not practical for weekly risk management on this name at these levels. The prior stop level from the September 25 coverage was $172.31 — that level held cleanly, never remotely tested during the subsequent price action, and the move has extended significantly above it since. Trail the stop up to $175.68 to reflect the uptrend's continued progress and lock in more of the existing gains.
Take Profit Targets
| Target | Level | Reasoning | Action |
|---|---|---|---|
| T1 | $190.25 (~+1.5% from current) | This week's intraweek high — a prior swing level price has already reached and pulled back from; reclaiming and closing above it on a weekly basis would confirm continuation, while failing to break it could act as near-term resistance | Light trim (10–15%) into strength if price stalls and reverses at this level; hold through on confirmed weekly close above |
| T2 | $200.00 (~+6.7% from current) | Prior swing high visible on the weekly chart, coinciding with a psychologically significant round number — the LC (Locked Chips) zone begins to thicken around this area as holders who bought above current price look to exit near breakeven; two independent structural reasons converge here | Trim 20–25% of position — meaningful overhead resistance with LC supply and prior swing high in confluence |
| T3 | $210.00 (~+12.0% from current) | Upper boundary of the LC overhead zone where the bulk of above-current-price volume has historically traded — a key zone where locked-chip selling pressure is likely to intensify and the overhead supply is densest | Trim another 20–25% — this is where supply pressure from holders sitting at a loss becomes most concentrated |
| T4 | $220.00 (~+17.4% from current) | Extended prior swing high from the weekly chart — price reached this zone in an earlier run and saw a meaningful reversal; this is where a strong continuation move would likely encounter its next structural ceiling | Trim remaining overweight to target-weight allocation; reassess trend state and confirmation score before adding back |
| T5 | $230.00+ (~+22.7% from current) | Blue-sky extension beyond known resistance — only relevant if all prior targets are broken with strong weekly closes and momentum continues to expand; no defined ceiling above $220 on the current chart | Hold a core position and trail stop aggressively; do not chase if momentum begins to decelerate |
Accumulation Levels
With the uptrend intact and the full MA stack aligned bullishly, there are real structural levels worth having on the radar for adding to a position on a pullback. These levels reflect the kind of organized support zones that longer-term and institutional buyers tend to treat as meaningful on the weekly chart.
| Level | Price Zone | Structural Reason | Action |
|---|---|---|---|
| L1 | $185.74 (~-0.9% from current) | Current POC — the point where the greatest volume has traded recently; a weekly close holding above it makes this the most immediate and natural support shelf. Price is currently oscillating around this level mid-week. | First add (33%) on confirmed weekly close back above the POC if price dips and reclaims it |
| L2 | $177–$180 (~-5% to -4% from current) | Prior POC from September 25 coverage ($177.21) and visible prior swing high on the weekly chart — confluence of a prior volume center and a visible prior price rejection level makes this a higher-conviction support zone than either alone | Second add (33%) on a retest of this zone with CMF holding above 0.05 and candle color remaining dark blue |
| L3 | ~$147.53 (~-21.3% from current) | Long EMA (MA3) at $147.53, currently Rising — a deep-pullback support level that would only become relevant if the uptrend experienced a significant structural breakdown; this is the system's long-term trend anchor | Final add (34%) only if price resets all the way to the Long EMA with a confirmed Bull Flip or Bottom Catch signal firing at that level — do not front-run a drop of this magnitude |
Worth noting: for PLTR's most reliable accumulation zone read, the Monthly chart tends to give the clearest picture, since higher timeframes filter out the noise that can make shorter-term levels less dependable — the weekly levels above are actionable, but the Monthly chart will reflect where the largest, most patient capital treats support as genuinely meaningful.
This is not financial advice. Always manage risk appropriately and never risk more than you can afford to lose.
Chart: PLTR Weekly — NASDAQ | September 29, 2026



Leave a Comment