
THS Trend Candles System | Weekly | September 30, 2026
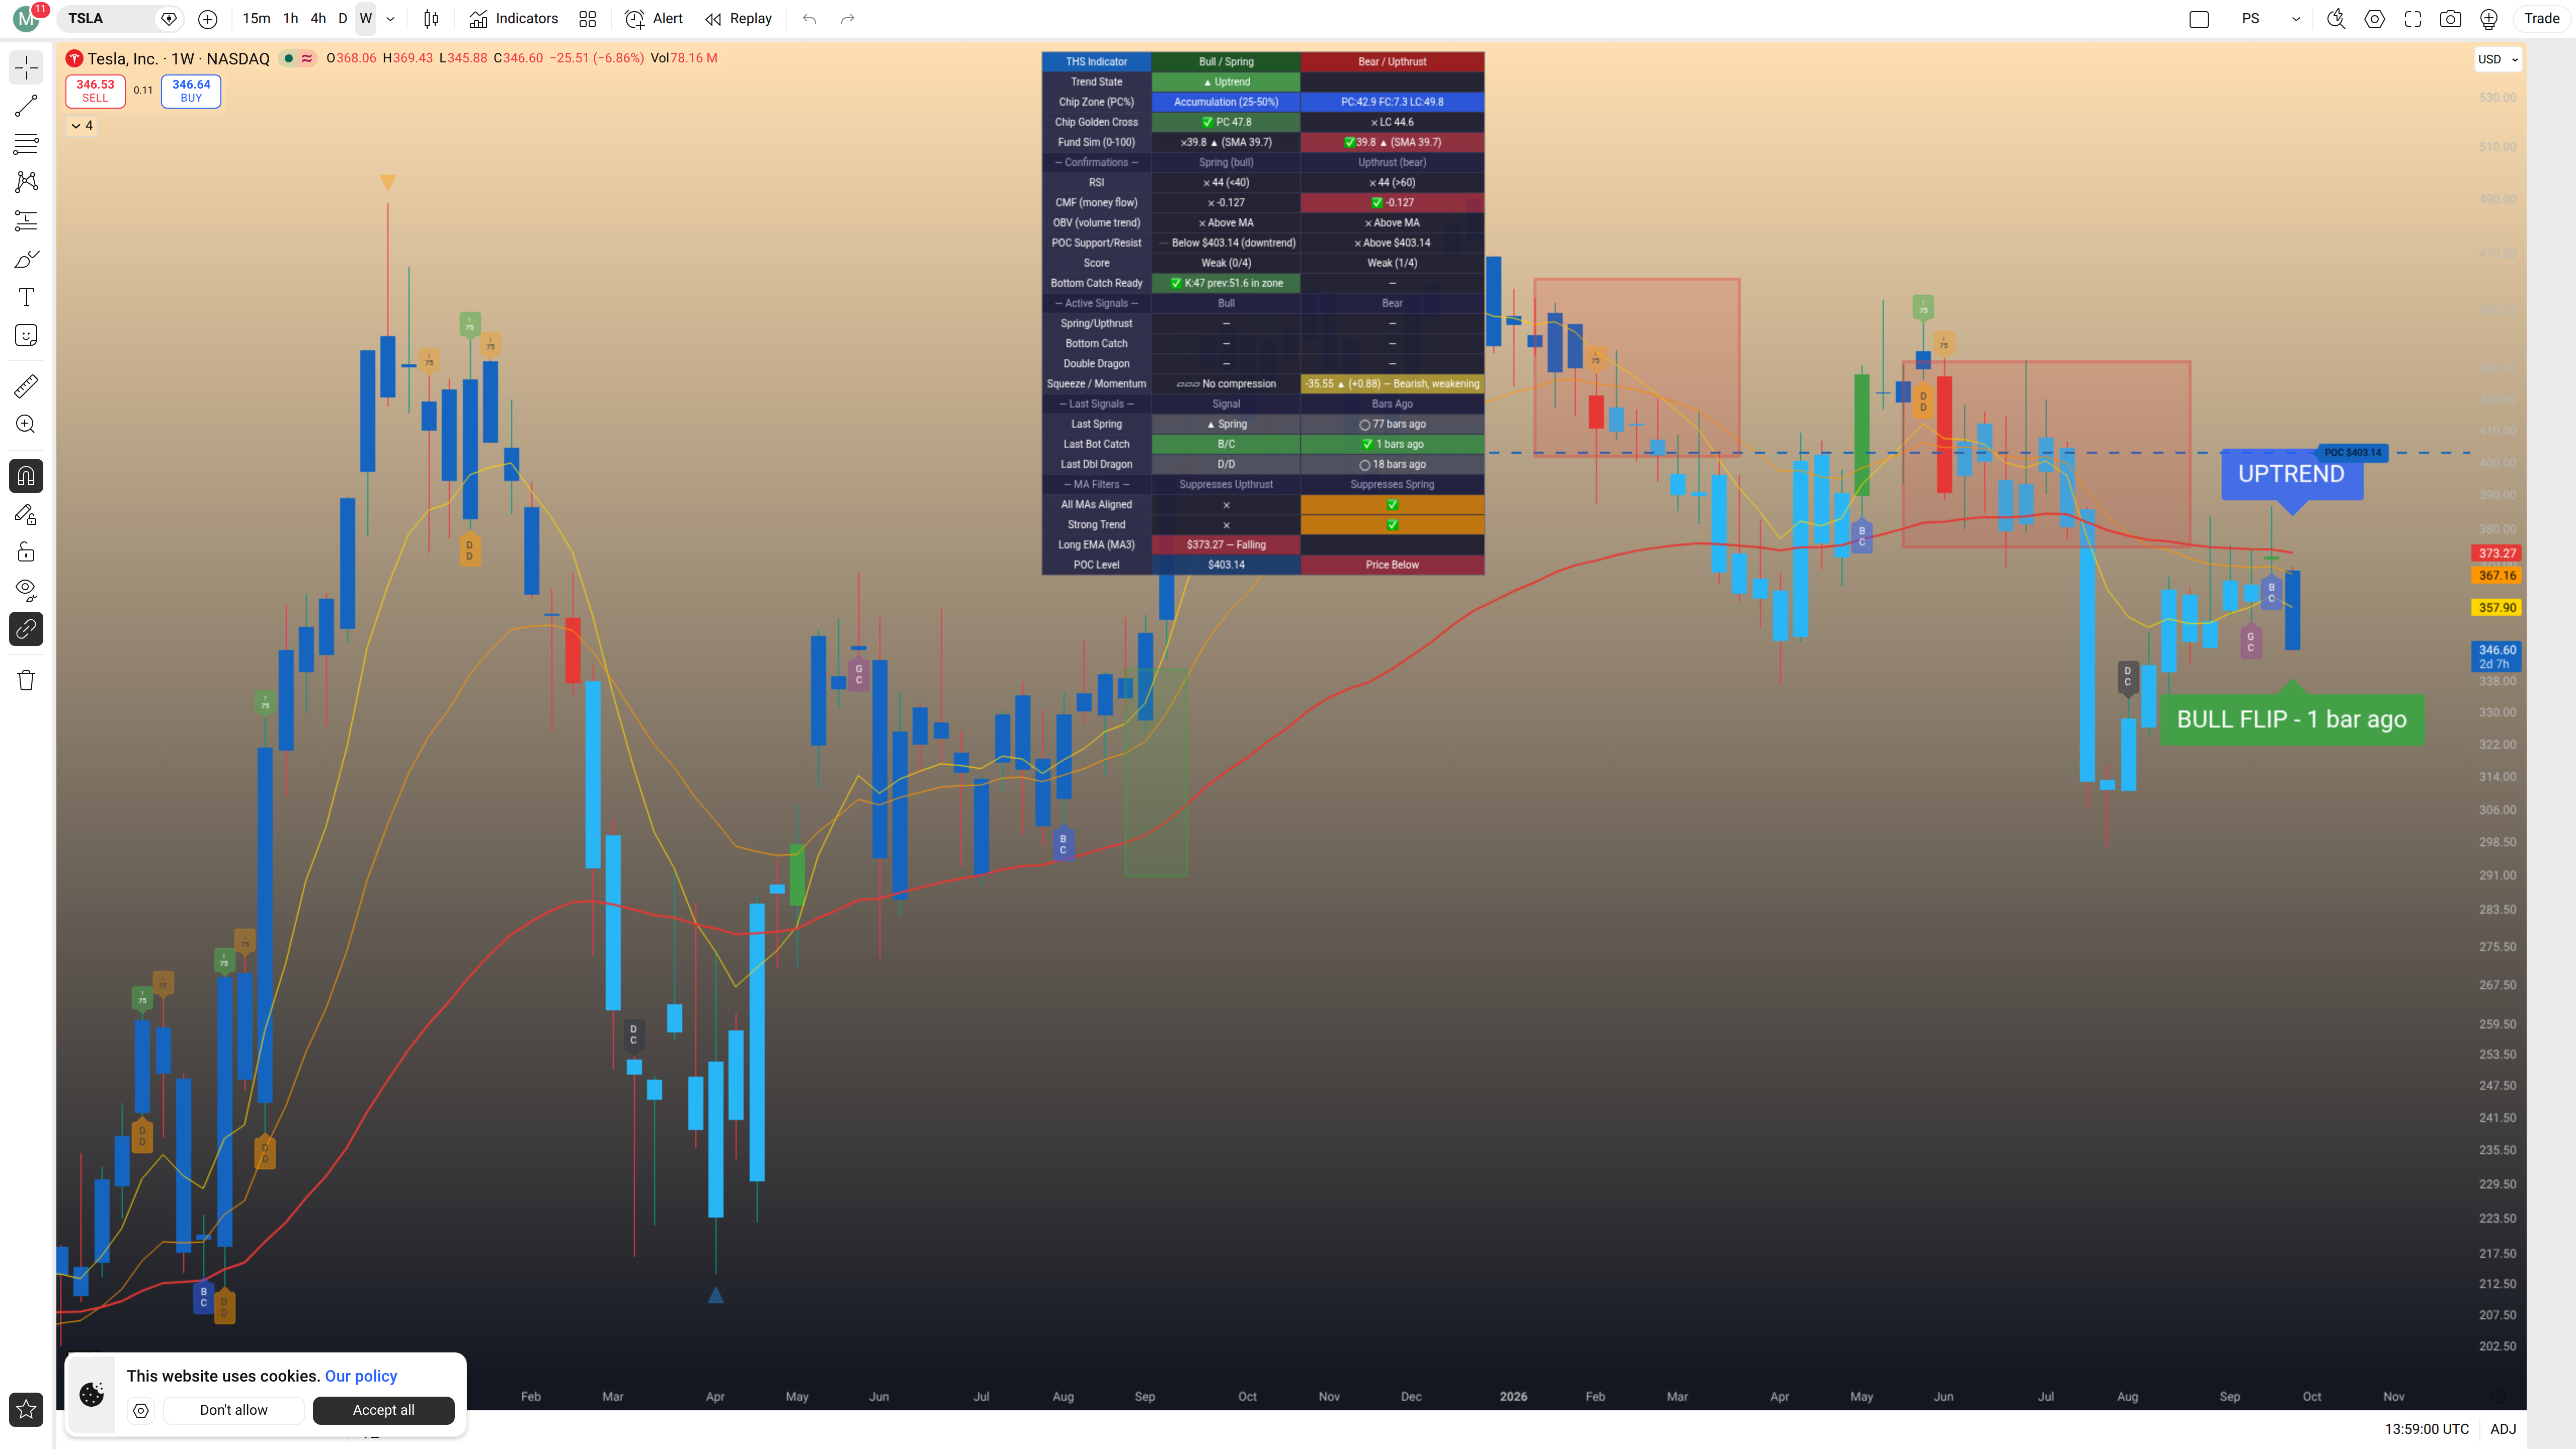
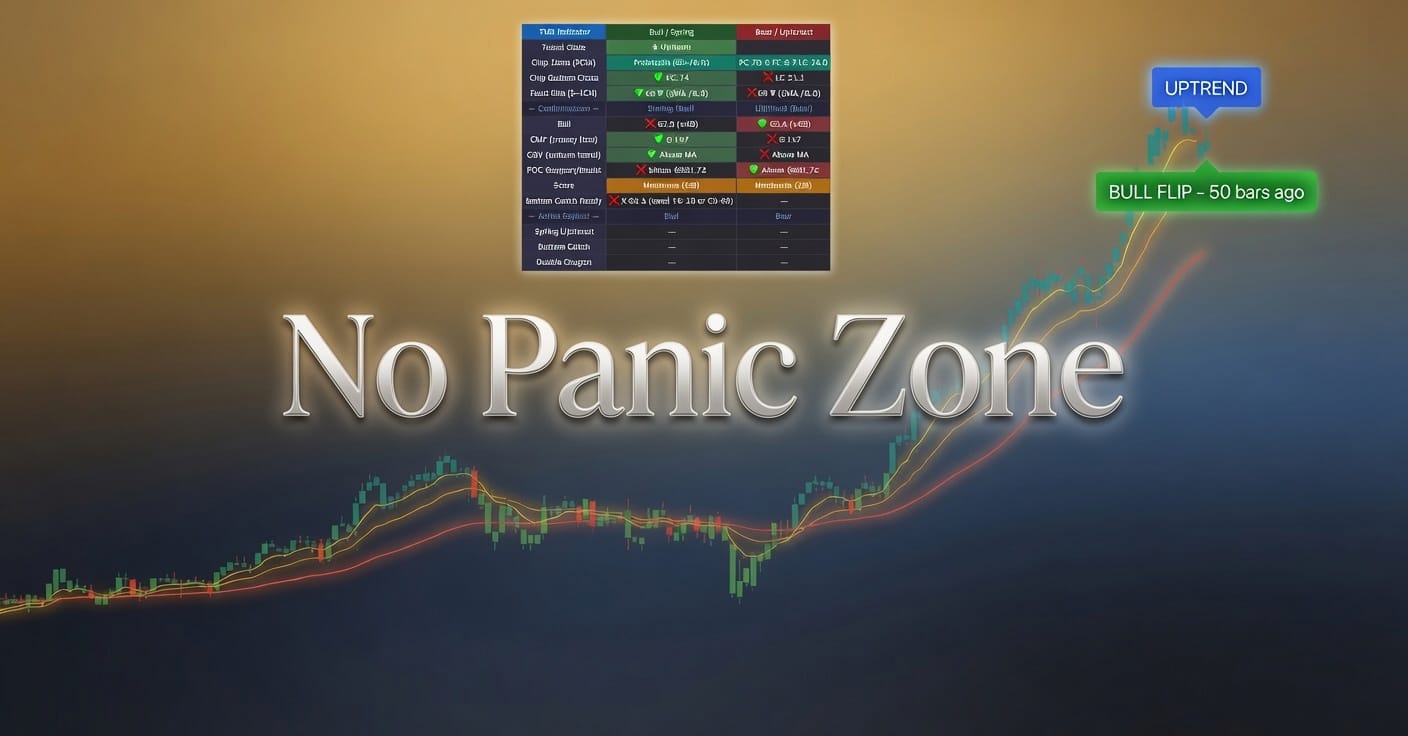
Don't worry about squinting at the small dashboard in the chart image above — every reading from it is broken out clearly in the summary table below.
Plain English
Despite a rough week so far, TSLA's weekly chart leans cautiously bullish — last week's Bull Flip is still the governing signal, and the broader uptrend label remains intact, making this week's pullback look more like a reset than a reversal. The most actionable move right now is to watch for this week and month to close to see all the actionable data under the hood. Tesla is the world's best-known electric vehicle and clean energy company, making everything from sedans to energy storage systems, and after a long base-building period the chart finally flipped bullish last week for the first time in months — momentum is still negative and bearish on the longer measure, but last week's Bottom Catch signal firing and Fund Sim pushing well above its SMA together suggest the underlying structure is shifting in bulls' favor. This candle is provisional and has not closed yet — any of these readings, including the candle's color and the OHLC values, could still change before Friday's close. Last time this chart was covered on September 25, 2026, the analysis called a Bull Flip fired that same bar (provisional) — that flip has now aged one week and the uptrend label is confirmed, which is exactly the follow-through that prior post was watching for.
Snapshot & Big Picture
Tesla, Inc. designs, manufactures, and sells electric vehicles, battery energy storage systems, solar products, and related software and services globally. After a prolonged consolidation and basing period spanning most of the visible chart history, price broke into a fresh Bull Flip last week — the first bullish trend-state change in a significant stretch — and is now in its first week of uptrend continuation. The governing signal is a Bull Flip — 1 week ago, with the current weekly candle showing as dark blue (uptrend continuation), though this is provisional until the week's close — a reversal in price before Friday could still change this reading. This week, TSLA has opened at $368.06, reached a high so far of $369.43, pulled back to a low of $345.88, and is currently trading near $346.60, down approximately 6.86% on the week with the current weekly period still in progress. This candle is provisional and has not closed yet — any of these readings, including the candle's color and OHLC values, could still change before Friday's close. Last covered on September 25, 2026, that analysis called a Bull Flip fired that bar at a provisional close of $371.82, with the trend state unconfirmed — one week later, the uptrend label has held and the flip has aged into a confirmed continuation bar.
| Factor | Reading | Signal |
|---|---|---|
| Prior Coverage | September 25, 2026 — Bull Flip fired that bar (provisional) | |
| Trend State | Bull Flip — 1 week ago (uptrend continuation, provisional) | |
| Chip Zone (PC%) | Accumulation (25–50%) — PC: 42.9, FC: 7.3, LC: 49.8 | |
| Golden Cross | PC SMA 47.8 ✓ — LC SMA 44.6 (no Golden Cross yet) | |
| Fund Sim (0–100) | 39.8 ▲ — above SMA 39.7 | |
| RSI | 44 — below 40 threshold for Spring confirmation, above 60 for Upthrust | |
| CMF (Money Flow) | -0.127 — below Spring confirmation threshold of +0.05 | |
| OBV (Volume Trend) | Above MA | |
| POC Support/Resist | Below $403.14 — price trading under the heaviest-volume level of the past year | |
| Bull/Bear Score | Bull: 0/4 — Bear: 1/4 (weak on both sides) | |
| Bottom Catch Ready | ✅ K: 47, prev 51.6 — in zone | |
| MA Filters | All MAs Aligned: neither Bull nor Bear — Strong Trend: neither Bull nor Bear | |
| Squeeze / Momentum | No compression — Momentum: -35.54 ▲ (+0.89), Bearish, weakening |
What the Chips Are Telling Us
- Profitable Chips (PC): 42.9% — just under half the volume distribution is sitting in profit at current prices, placing TSLA squarely in Accumulation territory.
- Float Chips (FC): 7.3% — a thin slice of active, liquid supply trading right at current levels, meaning the market isn't particularly crowded near this price right now.
- Locked Chips (LC): 49.8% — nearly half the distribution is sitting at a loss relative to current prices. That is a very significant overhang of underwater holders who represent real overhead resistance on any recovery attempt.
The Accumulation zone (25–50% PC) is exactly what it sounds like — the market hasn't fully absorbed all the prior selling, but enough of the distribution is profitable that buyers are beginning to compete with sellers for control. The chip zone tells you this is a transition point, not a confirmed breakout. With LC at 49.8%, there is a very large group of holders who bought higher and are likely to sell into any rally to reduce losses — this overhead supply is the structural headwind that will need to be worked through before TSLA can sustain a clean uptrend.
The Golden Cross check shows PC SMA at 47.8 versus LC SMA at 44.6. The PC SMA (the smoother, longer-term average of profitable chips) has crossed above the LC SMA — the dashboard marks this as a confirmed PC-side Golden Cross. That said, the raw LC percentage at 49.8% still exceeds the raw PC at 42.9%, so while the moving averages of chip distribution have crossed favorably, the current snapshot still shows more underwater holders than profitable ones. The Golden Cross on the SMAs is an early positive signal — it reflects improving trend in the underlying chip structure even if the instantaneous snapshot still shows LC slightly dominant. Watch for PC% itself to clear 50 on a sustained basis for the more definitive confirmation.
Fund Simulation
Institutional Pressure Edging Into Positive Territory
The Fund Sim reading comes in at 39.8, ticking up (▲) with its SMA sitting right at 39.7 — the reading is fractionally above its own average, which is the earliest possible version of institutional participation beginning to tip positive. A Fund Sim reading in the high 30s to low 40s is not a strong institutional buy signal by any means, but the direction matters: any reading rising above its SMA signals that simulated institutional demand is marginally outpacing the prior trend of selling. The gap between the two values (39.8 vs 39.7) is razor thin, so this is best described as a tentative cross, not a confirmed institutional accumulation signal — it warrants watching for the reading to build further separation above its SMA over the coming weeks.
Compared to the prior coverage on September 25, 2026, when the Fund Sim read 45.1 versus an SMA of 37.9, the current reading represents a meaningful pullback in the raw Fund Sim number from 45.1 to 39.8. The SMA has risen from 37.9 to 39.7 in the same period, which means the SMA has been catching up to what was a stronger reading last week. The net result is that the spread between Fund Sim and its SMA has compressed sharply — from a bullish gap of +7.2 points last week to a barely-positive +0.1 this week. This is a notable deterioration in the institutional simulation picture, and it tracks with this week's significant price pullback. The cross above SMA remains intact, but it needs to rebuild separation or it risks crossing back below.
Confirmations
Mixed Confirmation Picture — Structural Signals Not Yet Aligned
RSI: The RSI reads 44, which sits in a middling zone. For a Spring (bull) confirmation, the system looks for RSI to be below 40 at the time of the signal — RSI at 44 does not qualify for that Spring confirmation threshold. Likewise, a reading above 60 would be needed for an Upthrust (bear) confirmation — 44 is well clear of that. RSI is essentially neutral here, reflecting neither oversold conditions that would validate a classic bottom bounce, nor overbought conditions that would confirm exhaustion. The prior post noted RSI at 49.5 — the current reading of 44 shows modest softening, tracking with the week's price weakness.
CMF (Chaikin Money Flow): At -0.127, CMF remains firmly negative. For a Spring confirmation, this system requires CMF to clear +0.05 — genuine accumulation confirmation requires +0.10 or better. At -0.127, money flow is still showing net distribution, meaning volume-weighted buying pressure is losing out to selling pressure. This is the most straightforwardly bearish reading on the confirmation board right now. The prior post showed CMF at -0.15, so there has been a modest improvement from -0.15 to -0.127, but CMF remains well below even the minimum Spring confirmation threshold. Until CMF crosses zero and holds positive, buying pressure on a volume-adjusted basis has not confirmed the price-side recovery.
OBV (On-Balance Volume): On-balance volume is currently sitting above its moving average — a genuine positive for the bull case. OBV above its MA means cumulative buying volume has been outpacing cumulative selling volume on a trend basis. This is the cleanest confirmation currently on the board, and it aligns with the idea that underlying demand is present even as money flow (CMF) hasn't yet turned positive on a per-bar weighted basis.
POC (Point of Control): The current POC level sits at $403.14, and TSLA is currently trading at $346.60 — meaningfully below the heaviest-traded level of the past year. This means price is still under the most significant volume concentration, which acts as resistance on any recovery. The dashboard marks the Bull/Spring POC cell as "Below $403.14 (downtrend)" — price has not yet reclaimed the POC, which is a headwind for the bull case. Note that the prior post's POC figure came from the old calculation and is not directly comparable to the current $403.14 figure — the current POC is assessed on its own terms here. Reclaiming and holding above $403.14 would be a significant structural improvement for the bull case.
Bull/Bear Score: The Bull/Spring score comes in at 0 out of 4, and the Bear/Upthrust score at 1 out of 4 — both reading Weak. Neither side has a meaningful collection of confirmations at this moment, which reflects the genuinely transitional nature of this chart. The one Bear confirmation that registered is the CMF, which remains negative and flagged on the bear side of the dashboard. No Spring confirmations have cleared their thresholds yet.
Bottom Catch Ready: ✅ K: 47, previous reading 51.6 — in zone. The Bottom Catch system is showing the K value currently within the active zone, having pulled back from 51.6. The system fires a bottom catch signal when K drops into and through this zone from above — the prior post's Bottom Catch firing "this bar" (last week) was the active signal, and the current reading shows K moving lower inside the zone. Last week's Bottom Catch (B/C) signal, which fired 1 bar ago, remains the most recent active signal on this indicator.
Squeeze / Momentum: The compression tier reads No compression — there is nothing unusual building in terms of volatility contraction, and this week's wide range and significant down move are consistent with open, uncoiled price action rather than a setup building for a directional breakout. On the momentum side, the reading is -35.54, ticking up (▲) with a delta of +0.89. Applying the zero-convergence rule: the reading is negative and rising (moving toward zero from below) — this means bearish momentum is weakening, not strengthening. The on-chart label confirms: "Bearish, weakening." The delta of +0.89 on a reading of -35.54 is quite small in relative terms — this is the earliest sign of deceleration in the bearish push, but the magnitude is not large enough to call a decisive reversal in momentum yet. Compared to the prior post's momentum of -36.48, the reading has ticked from -36.48 to -35.54 — a marginal improvement but in the right direction, suggesting the bearish momentum that has dominated is slowly losing force. The prior post noted no compression tier (squeeze tier: none), which matches the current reading — no change there.
Last Signals
Recent Signals Anchoring the Bull Case
- Last Spring: ▲ Spring — 77 bars ago (approximately 18 months ago). The most recent Spring signal fired roughly a year and a half back — a distant historical reference that provides context for where the major low came from, but is not an active near-term signal in itself.
- Last Bottom Catch: B/C — ✅ 1 bar ago (last week). The Bottom Catch fired on the same bar as the Bull Flip last week — this is the most recent and most actionable signal on the board. A Bottom Catch firing coincident with a Bull Flip is one of the stronger short-term bullish combinations this system can produce, and its recency makes it the governing near-term signal.
- Last Double Dragon: D/D — 18 bars ago (approximately 4–5 months ago). The most recent Double Dragon pattern fired about four to five months ago. This is not an active signal at present, but it provides context for the prior trend structure.
The Bottom Catch firing just last week alongside the Bull Flip is the signal doing the most work for the bull case right now. A Bottom Catch is the system's read that price may be forming a meaningful low in the current structure — when it fires on the same bar as a trend flip, it adds conviction to the idea that the flip represents a genuine structural change rather than a noise event. The Spring from 18 months ago anchors the longer-term base — price has been rebuilding from that foundational low. The key question for the coming weeks is whether last week's Bottom Catch holds up and price uses this week's pullback as a healthy retest of the newly established uptrend, or whether the pullback deepens and negates the signal.
MA Filters
Neither MA Aligned — Early-Stage Transition Still in Progress
All MAs Aligned shows neither Bull nor Bear confirmed — the short, medium, and long moving averages have not all lined up in the same direction simultaneously, which means the MA structure as a whole does not yet confirm a clean, established trend. For All MAs Aligned to read Bull, all three MAs would need to be above price and sloping bullishly together — the short and medium MAs in particular are reactive and fast-moving, and a single week of strong selling pressure (like this week) can disrupt alignment quickly. The dashboard confirms this is the case: no check on either the Bull or Bear side for this row.
Strong Trend also reads neither Bull nor Bear — confirming that the long moving average (MA3, the slowest and most lagging of the three) has not yet established a confirmed directional slope that meets this system's criteria for a Strong Trend designation. The Long EMA (MA3) is currently reading $373.34 with a Falling slope. That Falling primary reading means the long-period moving average is still trending downward on the longer measure this system uses internally — and it's a long way above current price at $346.60, which means the Long EMA is acting as distant overhead rather than as nearby support. Both the All MAs Aligned and Strong Trend rows agreeing on "neither" is consistent with each other here — this is not a divergence situation, it's both checks agreeing that the chart is in an early-stage transition that has not yet produced the kind of sustained directional momentum needed for either MA filter to confirm. That's to be expected just one week after a fresh Bull Flip — these filters are inherently lagging, and they are correctly reflecting that the uptrend is brand new.
Signal & Action
Early Uptrend — Confirmation Still Building
TSLA's weekly chart is technically in an uptrend as of last week's Bull Flip, but the confirmation infrastructure behind that flip is thin — CMF remains negative, the POC has not been reclaimed, and the MA filters are both reading neither. The prior post's entry conditions called for a first entry on a confirmed weekly close above the Long EMA at $373.34 (the prior week's Long EMA value) — that condition was not met, as TSLA has been trading well below the Long EMA. The Long EMA currently sits at $373.34, still far above current price, so that original entry trigger remains unmet. The actionable posture is to hold for existing long-side exposure established near the flip, and for new entries to wait for either a confirmed weekly close above the prior week's high ($371.82, the prior close) with improving CMF, or a retest of the current week's low area with a bounce confirmed on the following week's open.
For Existing Holders
If you entered last week on the Bull Flip or the Bottom Catch signal, this week's pullback is worth monitoring carefully — it is a meaningful giveback from last week's close. The uptrend label still holds, and a healthy retest of a fresh flip is common before the trend reasserts. The line in the sand is a weekly close that decisively breaks below last week's low — if that happens, the bull case needs reassessment.
- Hold / Trim trigger: Hold while the weekly candle closes above the $330–$340 zone; consider a trim if a weekly close below $340 occurs with no recovery.
- Stop trail: Trail stops below $340
- What to watch: CMF crossing above zero on a weekly close; price reclaiming $371 (last week's close) with volume; Bottom Catch K remaining in zone without a clear breakdown signal.
For New Entries
For new positions, patience remains the higher-probability posture — entering into a 6.86% weekly pullback without confirmed CMF improvement is low-conviction. Wait for the weekly close before committing. Below are the safest for brand new entries, but if you want to be a little more aggressive you can use the accumulation table below:
- First entry (33%): On a confirmed weekly close back above $360–$365 with CMF crossing above -0.05, signaling the pullback is stabilizing is safest.
- Second entry (33%): The safest second entry would be on a confirmed weekly close above the POC at $403.14, which would represent a major structural reclaim, but that requires a lot of patience.
- Third entry (34%): On a confirmed weekly close above the Long EMA at $373.34, which would trigger the original entry condition and confirm the strong-trend phase of the recovery.
Stop Loss
The structural stop for this setup sits near $330 — just below the region where a confirmed weekly close would represent a decisive break of the current basing structure and negate the Bottom Catch fired last week. This level provides meaningful distance from the current intra-week low of $345.88 to avoid being stopped out by ordinary weekly volatility, while still protecting against a genuine breakdown.
Take Profit Targets
| Target | Level | Reasoning | Action |
|---|---|---|---|
| T1 | ~$371 (+7% from current) | Prior week's close — reclaiming last week's close level confirms the Bull Flip is holding and the pullback was absorbed | Take partial profits (20–25% of position) on a weekly close above this level |
| T2 | ~$403 (+16% from current) | POC at $403.14 — the heaviest-volume concentration of the past year; reclaiming this is the first major structural milestone and coincides with the lower boundary of the Locked Chips overhead zone | Take partial profits (25–30% of position) on a weekly close above $403 with follow-through |
| T3 | ~$430–$440 (+24–27% from current) | Prior swing high visible on the weekly chart — a clear reaction point price has tested before, sitting within the LC overhead zone; prior swing high AND Locked Chips supply zone — moderate confluence | Trim further (25% of remaining position) on approach to this zone |
| T4 | ~$490–$500 (+41–44% from current) | Significant prior swing high visible on the weekly — a major prior resistance area deep within the LC zone, representing the upper bound of the heaviest overhead supply | Trim aggressively into strength; LC supply likely to create heavy selling pressure here |
Accumulation Levels
With the trend in an early uptrend — Bull Flip 1 week ago — there are real structural levels worth watching for adding to positions on any further pullback in the coming weeks.
| Level | Price | Reasoning | Action |
|---|---|---|---|
| L1 | ~$345–$350 (current area) | Intra-week low zone — the current week's low of $345.88 represents the first test of the newly established uptrend; if this week closes near here with a stabilizing pattern, it becomes the first accumulation reference | Small initial position only on a confirmed weekly close above $350 with signs of stabilization; do not scale in ahead of the weekly close |
| L2 | ~$330–$335 (~4% below current) | Prior swing low visible on the weekly chart — a clear support reaction zone that provided meaningful buying in the prior basing structure; coincides with the region where the Bottom Catch K would be expected to remain in zone on a further pullback | Add on a retest and bounce; Bottom Catch K still in zone would be a supporting condition for adding here |
| L3 | ~$295–$305 (~13–15% below current) | Deeper prior swing low on the weekly — the major structural low that preceded the long basing period; a retest here with a confirmed weekly bounce would be a high-conviction scale-in opportunity, representing a full retest of the base | Scale in more aggressively on a weekly bounce from this level with improving CMF; treat as the highest-conviction accumulation zone if price gets here |
Worth noting: for TSLA's most reliable accumulation zone read, the Monthly chart tends to give the clearest picture, since higher timeframes filter out the noise that can make shorter-term levels less dependable.
This is not financial advice. Always manage risk appropriately and never risk more than you can afford to lose.
Chart: TSLA Weekly — NASDAQ | September 30, 2026



Leave a Comment