
THS Trend Candles System | Monthly | September 1, 2026
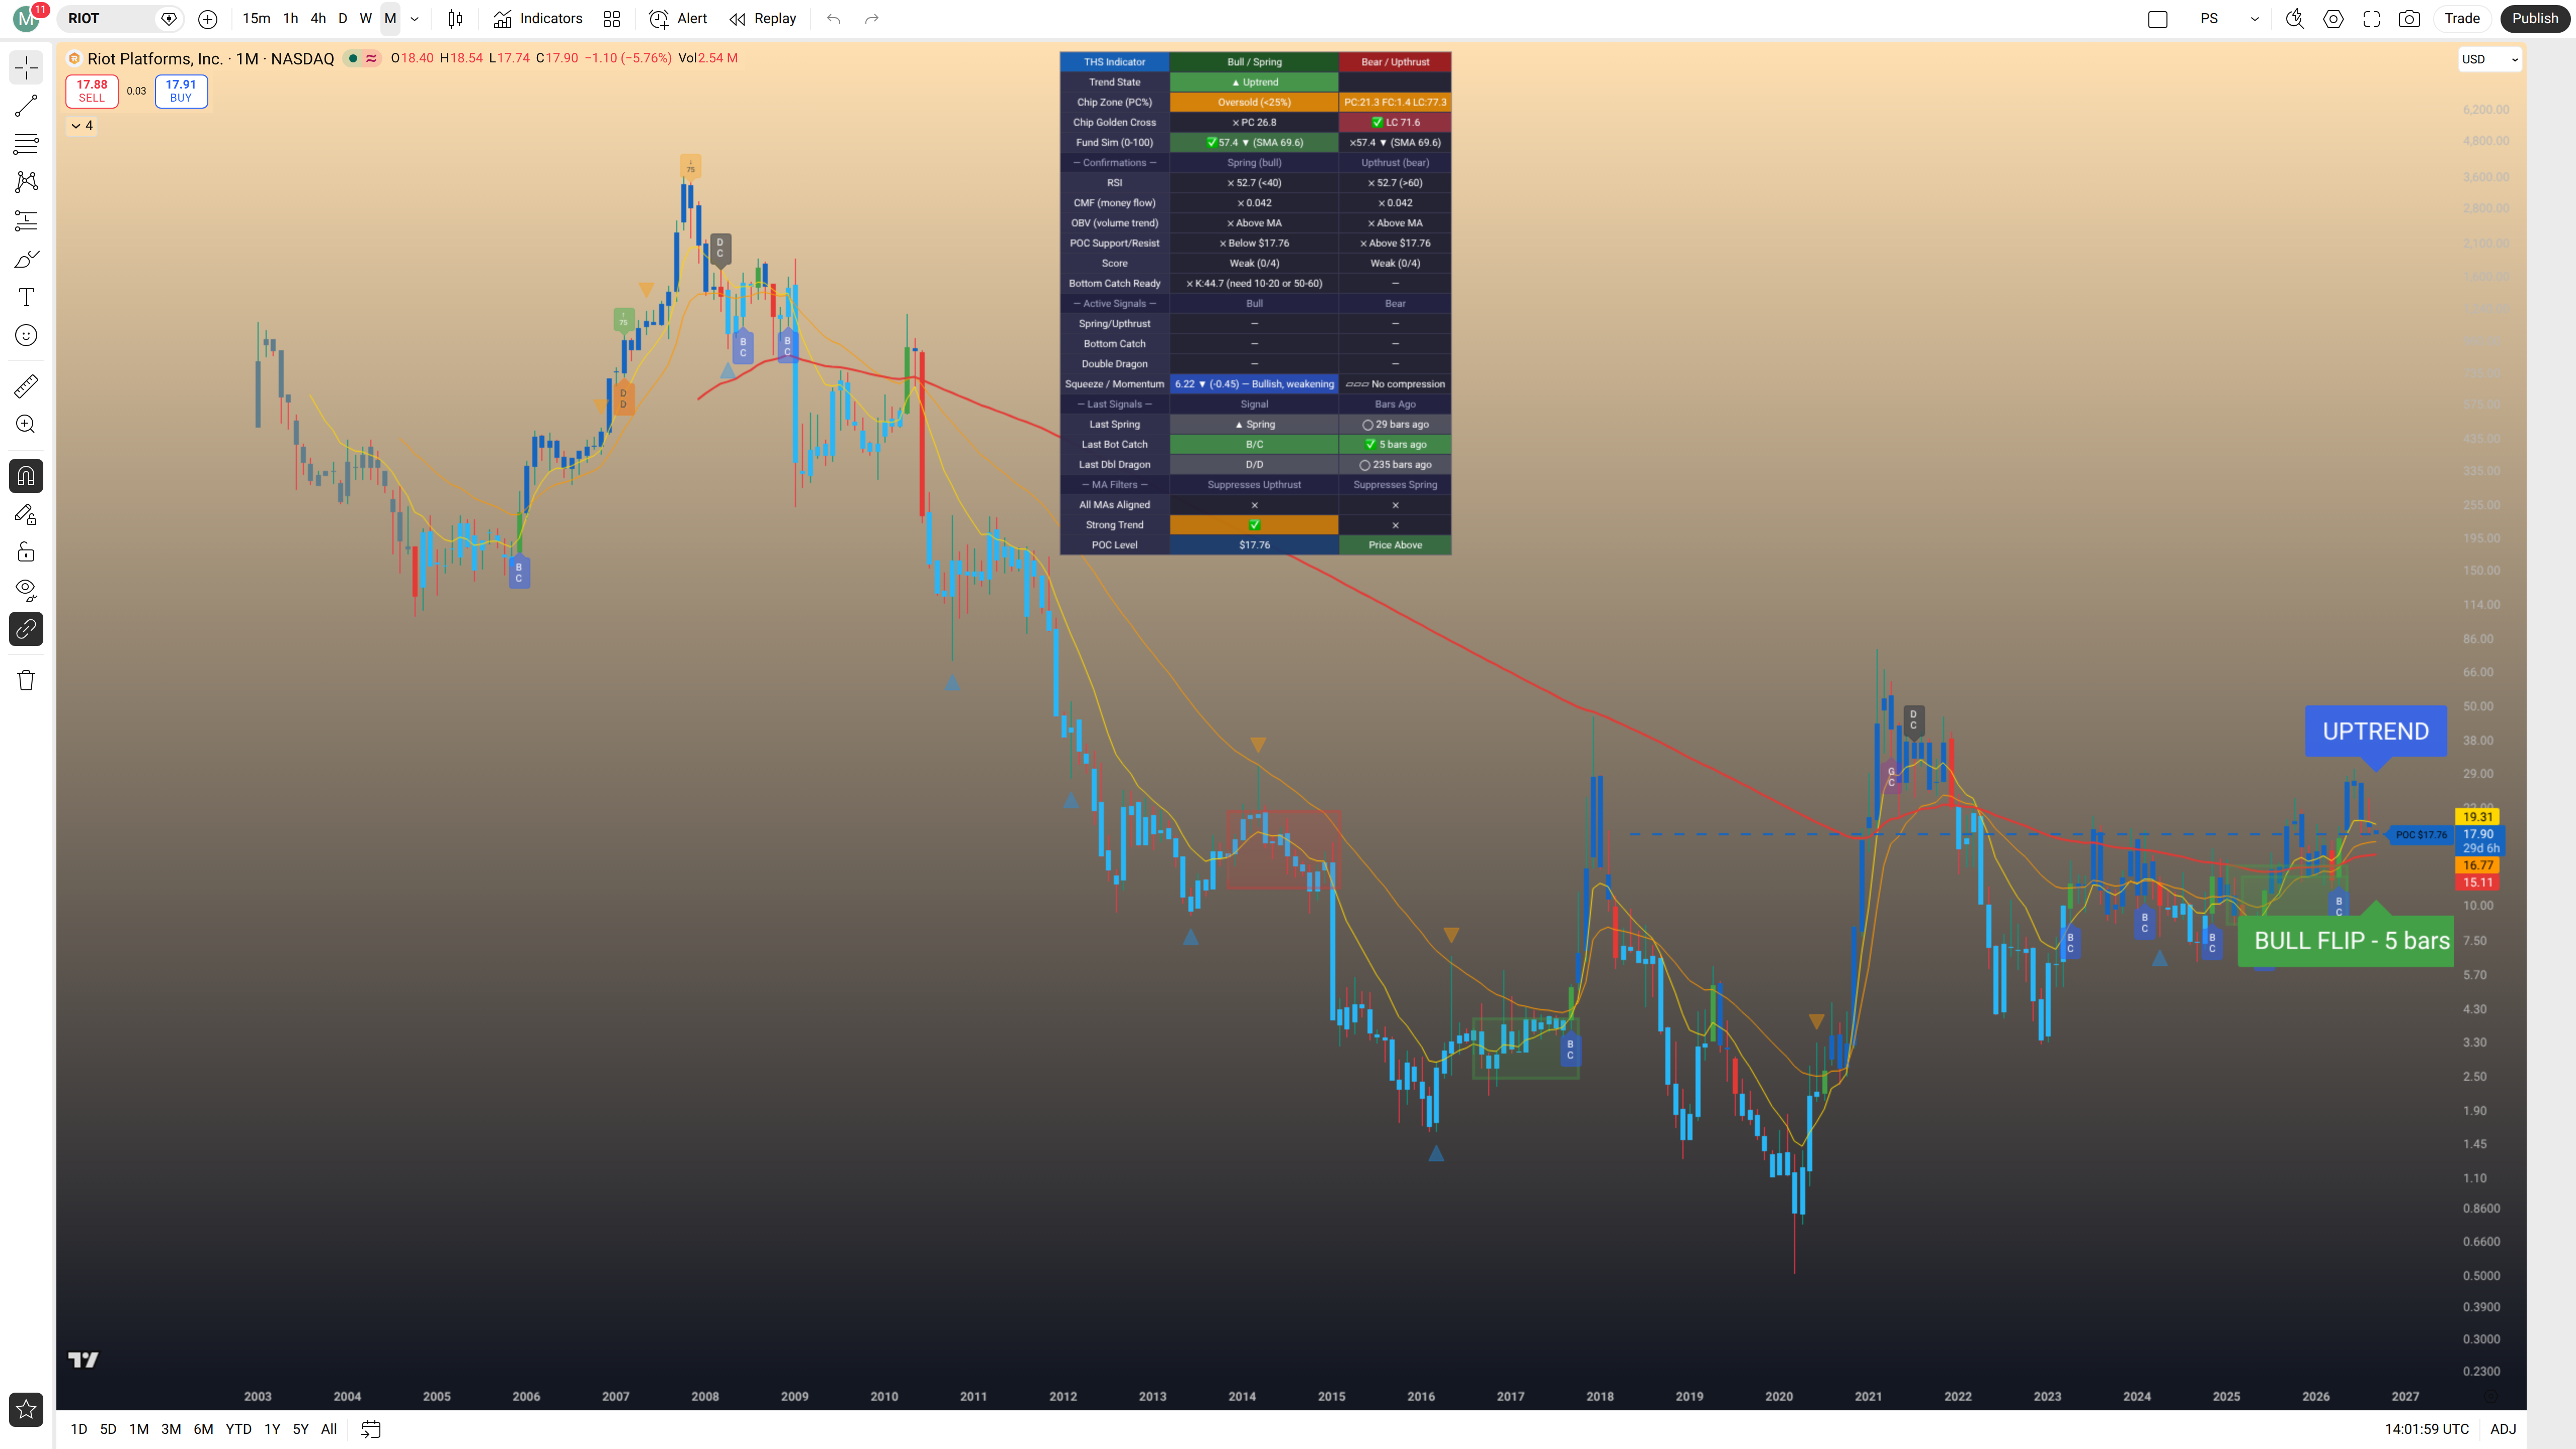
Don't worry about squinting at the small dashboard in the chart image above — every reading from it is broken out clearly in the summary table below.
Plain English
RIOT leans bullish on the monthly chart — the long-term trend flipped back upward five months ago and has been holding that direction since, so the path of least resistance on a bigger-picture basis still points higher, making this a reasonable spot to watch for dips toward key support levels as potential add opportunities rather than panic exits. Riot Platforms is one of the largest publicly traded Bitcoin miners in the United States, meaning its stock price tends to move dramatically with Bitcoin's own cycles — huge run-ups when crypto is hot, steep drawdowns when it cools. The monthly chart tells the story of exactly that: a massive surge into 2021, a brutal multi-year collapse, and now a recovery that — as of five months ago — officially flipped back to a bullish trend on this timeframe, supported by a trend-state confirmation, bullish squeeze momentum (though that momentum is weakening), and price trading above its point of control. That said, this September candle is provisional and has not closed yet — it just opened today, which means it's the very first day of the month, so treat this month's candle color and trend reading as a loose, early signal rather than a settled one, and any of these readings could still shift considerably before the month closes.
Snapshot & Big Picture
Riot Platforms, Inc. is a Bitcoin-focused digital asset company that operates one of the largest Bitcoin mining facilities in North America, making it one of the most direct equity proxies for Bitcoin price exposure available on US exchanges. The monthly chart shows a stock that experienced a staggering boom-and-bust cycle — surging from under $1 to nearly $80 between 2020 and early 2021 during the first major crypto bull run, then collapsing more than 98% to near-penny-stock lows by late 2022, before beginning a multi-year base-building recovery. The governing signal is a Bull Flip — 5 months ago, with the current candle showing as a dark blue uptrend continuation, though this is provisional until the September monthly close — a reversal in price before then could still change this reading. So far this month, RIOT has opened at $18.40, reached a high of $18.54, dipped to a low of $17.74, and is currently trading at $17.90, down approximately 5.76% from the prior month's close as of this writing. This candle is provisional and has not closed yet — it just opened on the first day of September, so treat this month's candle color and trend reading as a loose, early signal rather than a settled one.
| Factor | Reading | Signal |
|---|---|---|
| Trend State | Bull Flip — 5 months ago (uptrend continuation, provisional) | |
| Chip Zone (PC%) | Oversold (<25%) — PC: 21.3%, FC: 1.4%, LC: 77.3% | |
| Golden Cross | LC SMA 71.6 confirmed — PC SMA 26.8 (Death Cross territory) | |
| Fund Sim (0–100) | 57.4 ▼, SMA 69.6 — below its own SMA, declining | |
| RSI | 52.7 — above 40 (not oversold), not yet at overbought | |
| CMF (Money Flow) | 0.042 — positive but below the 0.05 spring confirmation threshold | |
| OBV (Volume Trend) | Above its MA — volume trend supporting price | |
| POC Support/Resist | POC at $17.76 — price currently above it | |
| Bull/Bear Score | Weak — 0/4 Bull, 0/4 Bear | |
| Bottom Catch Ready | K: 44.7 — not in required zone (needs 10–20 or 50–60) | |
| MA Filters | All MAs Aligned: neither Bull nor Bear confirmed; Strong Trend: Bull still active | |
| Squeeze / Momentum | No compression; Momentum 6.22 ▼ (−0.45) — Bullish, weakening |
What the Chips Are Telling Us
- Profitable Chips (PC): 21.3% — only about one in five shares in the price-volume distribution is sitting in a profit position relative to where price is today. The vast majority of holders are underwater.
- Float Chips (FC): 1.4% — just 1.4% of the distribution is actively trading near the current price, meaning there is very little liquid supply clustered at these levels to absorb a move in either direction.
- Locked Chips (LC): 77.3% — a dominant 77.3% of the distribution is sitting at a loss relative to the current price. These holders bought at higher prices during the 2021 peak and the various failed recovery attempts, and they represent enormous potential overhead supply — anyone who has been sitting in a loss position for years has a strong motive to sell into any meaningful rally to cut their losses or recover their cost basis.
The chip zone reading is Oversold (PC below 25%), which confirms just how deeply in the hole the average holder in RIOT's history still is. This is not an unusual place for a post-bust Bitcoin miner to find itself — the 2021–2022 drawdown was so severe that only a complete return to all-time highs would put the majority of historical shareholders back in the green. The positive reading here is that Oversold chip conditions have historically been associated with accumulation phases when combined with a bullish trend flip, because it means the stock has already been beaten down so thoroughly that motivated sellers have mostly been shaken out.
The Golden Cross configuration is not supportive right now. The LC SMA sits at 71.6 and the PC SMA sits at 26.8 — a confirmed Death Cross configuration, meaning the average of the locked/underwater chip positions is running higher than the average of the profitable chip positions on the SMA basis. Until the PC SMA climbs above the LC SMA and establishes a Golden Cross, the chip distribution will continue to act as a structural headwind on rallies, with that 77.3% LC overhang representing potential sell pressure from holders looking to recover from losses. This is the single biggest long-term structural drag visible on this chart — it will take a sustained, extended rally to work through it.
Fund Simulation
Institutional Demand Fading Below Its Own Average
The Fund Simulation score currently reads 57.4, pointing downward (▼), and sitting below its own SMA of 69.6. This score measures simulated institutional fund activity — a reading above 50 generally indicates net buying pressure from larger, smarter-money participants, while a reading below 50 suggests institutional money is net selling or withdrawing. At 57.4, we are still technically above the neutral midpoint of 50, meaning there is a modest net positive tilt to institutional activity — but the trend is the concern here. The reading has been declining and has now crossed below its own SMA at 69.6, which is a meaningful signal that the institutional buying interest that helped fuel the Bull Flip five months ago has been cooling. A Fund Sim value below its SMA is a warning flag, even when the absolute value is still above 50, because it indicates the flow of institutional participation is decelerating rather than accelerating into this uptrend.
A Fund Sim reading that is declining toward 50 while the trend state is still bullish is a common pattern after a fresh flip — the initial burst of institutional buying that triggers the flip fades, and the market needs time to see whether real fundamental demand re-emerges to push the score back up, or whether it continues deteriorating toward the bearish zone below 50. Right now the score needs to stabilize, ideally turn back above its SMA of 69.6, to confirm that large-money participants are re-engaging with RIOT's uptrend rather than using the flip-fueled bounce as an exit opportunity.
Confirmations
A Mixed Confirmation Picture — One Solid Check, The Rest Incomplete
RSI: 52.7 — Sitting right in the middle of the neutral zone. The RSI confirmation threshold for a bullish spring setup requires a reading below 40 to confirm oversold conditions turning up, and this chart's RSI at 52.7 clears that bar in reverse — it's not oversold, which means the "spring from the bottom" type of momentum hasn't been the driving force here. On the bear side, a confirmation of an upthrust would require RSI to be above 60, and at 52.7 it falls short of that as well. Neither the bull nor the bear confirmation is triggered by RSI alone — this is a genuinely neutral reading sitting on the fence between the two regimes.
CMF (Chaikin Money Flow): 0.042 — Positive, which is the right direction for a bullish uptrend, but it falls just short of the key thresholds. CMF needs to clear 0.05 to confirm a bullish spring setup, and 0.10 to signal genuine accumulation by volume-weighted smart money. At 0.042, it's close to the 0.05 spring confirmation level but hasn't crossed it. This is an encouraging reading directionally — money flow is positive, not negative — but it isn't yet a confirmed bullish signal. Given that this is the first day of the new September monthly candle, this reading could shift over the coming weeks.
OBV (On-Balance Volume): Above its MA — This is the cleanest bullish confirmation on the board. Volume-weighted price action is trending above its moving average, meaning that on net, accumulation days have outweighed distribution days in a volume-weighted sense over the recent period. This is exactly what you want to see in a legitimate uptrend — it tells you the volume behind up-days has been stronger than the volume behind down-days, which is the footprint of real demand.
POC at $17.76 — price currently above it: The Point of Control, the price level with the highest concentration of historical trading volume, sits at $17.76. With the current price at $17.90, RIOT is trading just barely above this level. This is an important detail — the POC acts as a magnet and as a support/resistance flip level. Holding above the POC is bullish context; it means price has not retreated into the heaviest volume zone. However, the margin is razor-thin at roughly $0.14. A meaningful move lower that breaks below $17.76 on a closing basis would be a significant near-term concern worth monitoring closely.
Bull/Bear Score: Weak — 0/4 Bull, 0/4 Bear: The confirmation scoring system requires a combination of RSI, CMF, OBV, and POC conditions being met simultaneously to register a scored reading. Neither the bull nor the bear side has accumulated enough simultaneous confirmations to trigger a score — this is a "Weak" reading on both sides, meaning the evidence isn't yet stacked enough to call a high-conviction bullish or bearish case through the confirmation lens. Trend State is bullish, but the confirmation score hasn't yet validated it with the full weight of the system's checks.
Bottom Catch Ready — K: 44.7, not in zone: The Bottom Catch system requires the stochastic K value to be sitting in either the 10–20 zone (deeply oversold) or the 50–60 zone (momentum reset area) to be "ready" to fire. At K: 44.7, we're sitting in no man's land between those two zones — above the deep oversold range but below the reset zone. The Bottom Catch signal is not ready to trigger at this reading.
Squeeze & Momentum: The compression tier currently reads No compression — there is nothing unusual building in RIOT's price range contraction. This is not a coiled setup, and the language of "a bigger move is coming" is not warranted by this tier — simply describe the current trend's character. On the momentum side, the reading is 6.22 ▼ (−0.45), and the on-chart label reads "Bullish, weakening" — cross-checking this against the zero-convergence rule: the reading is positive (6.22) and the arrow is pointing down (▼), which means the momentum is a positive reading moving toward zero — bullish push weakening. This matches the dashboard's own label exactly. The delta of −0.45 represents roughly a 7% reduction in the momentum reading from the prior bar, which is not trivial relative to the magnitude of 6.22 — this deceleration is meaningful and worth watching. Price has been in an uptrend for five months, but the force behind that uptrend at the monthly level is losing steam. Without compression building to suggest a new impulse is storing energy, the current momentum profile describes a trend that is gradually fading rather than accelerating.
Last Signals
Recent History: A Spring, A Bottom Catch, and an Ancient Double Dragon
- Last Spring: ▲ Spring signal — fired approximately 29 months ago (roughly 2.4 years ago). The hollow circle emoji indicates this signal did not fully mature into a confirmed sustained move at the time — a Spring that fires but doesn't follow through cleanly is worth noting as background context but shouldn't be weighted heavily as a recent setup confirmation.
- Last Bottom Catch: B/C signal — fired approximately 5 months ago (the same timing as the Bull Flip), with the confirmed checkmark emoji indicating it successfully triggered. This is the most recent and most directly actionable historical signal — a Bottom Catch five months ago coinciding with the Bull Flip is meaningful alignment. That B/C is 5 bars old and confirmed.
- Last Double Dragon: D/D signal — fired approximately 235 months ago, roughly 19.6 years ago. This is effectively ancient history on the monthly chart — a Double Dragon pattern from nearly two decades ago has no near-term relevance, though it does mark a significant structural moment from the company's earliest trading history.
The governing signal is the Bull Flip that fired five months ago, supported at the same time by a confirmed Bottom Catch. The alignment of these two signals — a trend-state flip and a Bottom Catch confirmation firing simultaneously — is the foundation of the current bullish case on this monthly chart. Both signals traced to the same moment in time, roughly five months ago. The Spring signal from 29 months ago is too old and carried a hollow (unconfirmed) designation, making it historical context rather than active support. The key question going forward is whether the uptrend can sustain itself over the coming months with the Fund Sim declining and momentum weakening — the signals themselves were real, but signals don't guarantee a sustained trend on their own.
MA Filters
Short-Term Alignment Has Already Broken Down — The Long MA Still Holds
The MA Filters section contains two genuinely different readings that tell a nuanced, diverging story right now. All MAs Aligned shows neither Bull nor Bear confirmed — the checkmark on both sides reads as an X (not checked). This means the short-period MA, medium-period MA, and long-period MA are not all simultaneously aligned in the same direction, and/or the shorter MAs are no longer actively sloping bullishly across the board. This is a fast-reacting check, and it flips to "neither" quickly once even one or two of the faster MAs roll over. Five months into an uptrend, with momentum weakening and the Fund Sim declining, it is entirely consistent that the short-term moving average structure has already begun to soften — All MAs Aligned failing to confirm is a real near-term warning signal.
Strong Trend, on the other hand, still shows a Bull checkmark confirmed, with no Bear confirmation. This check looks exclusively at the long-period moving average — specifically whether price is above it and whether that long MA itself is still sloping upward relative to several bars prior. Because this is the slowest, most lagging of the three MAs, it takes a much longer period of sustained bearish price action to reverse it. The fact that Strong Trend still reads Bull while All MAs Aligned has already lost its bullish confirmation is a classic lagging-versus-leading divergence: the short-term structure has softened and rolled, while the longer-term structural backbone hasn't broken yet. This is not a contradiction — it is a meaningful, nuanced observation. It means RIOT's uptrend is still intact at the slow-moving structural level, but the near-term internal structure is fraying. If the short-term MAs do not re-align bullishly soon, continued weakness could eventually pull the long MA out of its bullish slope — but that process takes time on a monthly chart, and for now, the long-term trend support is still there.
Signal & Action
Bullish Trend Intact — Weakening Internals Warrant Patience
The overall posture on RIOT's monthly chart is bullish by trend state, with a Bull Flip five months ago and price still holding above the POC — but the weight of the internal evidence (Fund Sim below its SMA, momentum declining, All MAs Aligned not confirming, Confirmation Score 0/4, chip zone deeply oversold with a Death Cross) argues for patience over aggression. This is a "stay long but do not chase" setup for those already positioned, and a "wait for a better entry" setup for those looking to initiate.
For Existing Holders
If you are already long RIOT from the Bull Flip five months ago or from levels near or below the POC at $17.76, the trend state is still in your favor and there is no technical reason to exit a position with a properly managed stop in place. However, with momentum weakening and the Fund Sim declining below its SMA, this is not the environment to add aggressively at current levels. Watch for the Fund Sim to stabilize and turn back up toward its SMA, and for CMF to clear 0.05, before treating any position addition as confirmed by the indicators.
- Hold trigger: Price holding above POC at $17.76 on a monthly closing basis — this is the line in the sand. As long as the monthly candle closes above it, the bullish case remains structurally intact.
- Stop trail: Trail your stop up as RIOT makes higher lows — current suggested stop level is below the POC at $15.11 (see Stop Loss section), which gives the trade room to breathe without exposing to a structural breakdown.
- What to watch: Fund Sim recovering back above its SMA of 69.6, CMF clearing 0.05, and All MAs Aligned re-confirming Bull — those three together would represent a meaningful internal re-strengthening of the uptrend.
For New Entries
With the trend bullish but internals weakening, new entries are best initiated on a pullback toward structural support rather than chasing price at current levels on the first day of a new monthly candle.
- First entry (33%): On a retest of the POC at $17.76 with price holding above it on a monthly closing basis — this is the primary structural support level right now and the highest-probability pullback entry if the market gives it.
- Second entry (33%): On a confirmed monthly close above the current monthly high of $18.54, with CMF above 0.05 and Fund Sim recovering above its SMA — this is a breakout-continuation entry on strengthening internals.
- Third entry (34%): On a deeper pullback to the $15.11 level (the long MA / next major structural support visible on chart) if the POC fails — only enter here if the trend state has not flipped bearish and OBV remains above its MA, confirming accumulation rather than distribution at that level.
Stop Loss
The structural stop for RIOT on the monthly chart sits at $15.11, which corresponds to the current level of the long moving average (the slow red MA plotted on the chart) and a zone of prior structural support visible on the chart. A monthly candle closing below this level would indicate that even the long-period trend support has been violated, and the bullish case would need to be reassessed. This level provides adequate room above the 2022 lows while still being meaningfully below the POC at $17.76 — if the POC breaks on a closing basis, there is a zone of support and MA confluence around $15.11 that serves as the next real structural line. Anything below that on a monthly close is a clear technical stop-out. The risk from current levels (~$17.90) to stop (~$15.11) is approximately 15.6%, which is normal for a monthly-timeframe trade on a high-volatility Bitcoin miner.
Take Profit Targets
| Target | Level | Reasoning | Action |
|---|---|---|---|
| T1 | ~$25–$26 (+39–45% from current) | Lower boundary of the LC (Locked Chips) zone — 77.3% of the distribution sits above current price; the lower edge of that overhead supply zone begins as price moves back toward levels where significant historical volume accumulated during 2021–2022. This is the first major resistance layer where trapped sellers will likely begin exiting. | Trim 25% of position on approach; watch for monthly close to confirm ability to hold through resistance before re-adding. |
| T2 | ~$38–$40 (+112–123% from current) | Prior swing high visible on the monthly chart — a level RIOT reacted to meaningfully during the 2023–2024 recovery rally before pulling back. This is a genuine prior monthly swing high, not a round number — it coincides with a dense area of the LC zone where a large cohort of 2022 buyers sits at approximately breakeven. | Trim another 25% of position here; significant supply expected from trapped 2022 holders approaching their cost basis. |
| T3 | ~$55–$60 (+207–235% from current) | Mid-range LC zone — deeper into the overhead supply distribution, corresponding to the heaviest concentration of 2021 buyers who are still underwater. At this range, the LC zone begins transitioning from "some relief" to "heavy overhead." Prior swing high confluence visible on the 2021 monthly chart structure. | Trim another 25% of remaining position; re-evaluate trend strength before allowing the final portion to run further. |
| T4 | ~$75–$80 (+319–347% from current) | All-time high zone and top of the LC distribution — the 2021 peak around $79 represents the upper boundary of the Locked Chips zone and the level where PC flips back to near 100%. This is a high-confluence target: prior all-time high swing AND top of the LC overhead supply zone simultaneously. Strongest resistance on the entire monthly chart. | Exit remaining position at or below the all-time high unless trend state, Fund Sim, and chip zone all support a sustained breakout above prior highs. |
Accumulation Levels
With the Trend State in a bullish uptrend (Bull Flip five months ago, currently a dark blue continuation candle), this monthly chart supports a real accumulation table for investors looking to build or add to a position. Every level below is tied to a specific structural reason visible on this chart — no round numbers invented without basis.
| Level | Price | Structural Reason | Action |
|---|---|---|---|
| L1 | $17.76 (~−0.8% from current) | POC (Point of Control) — the single most traded price level in RIOT's monthly distribution. A retest of the POC from above, with price holding on a monthly closing basis, is the highest-conviction, closest accumulation opportunity on this chart. Price is currently only $0.14 above this level, making it the most immediately relevant support zone. | Add on retest and monthly close above $17.76 — confirm OBV remains above MA before adding. |
| L2 | $15.11 (~−15.6% from current) | Long moving average (red MA) current level — this is the slow structural trend support on the monthly chart. A pullback to this level that holds as support, with the trend state still bullish and OBV above MA, represents a deep but structurally meaningful accumulation opportunity. Higher conviction if CMF also remains positive at this level. | Scale in on a monthly close confirmation that this level holds — do NOT add if trend state has flipped Bear by the time price arrives here. |
| L3 | ~$10–$11 (~−39–44% from current) | Prior swing low visible on the monthly chart — the 2023 consolidation zone that served as a multi-month base before the Bull Flip. This is a genuine prior swing low from chart structure, not an invented number. A retest of this zone in a deeper macro correction would represent a high-value, high-risk accumulation opportunity only if the broader trend structure is still recoverable. | Only consider if trend state has re-established Bull Flip from this zone — do not catch a falling knife here without a confirmed flip signal. |
This is not financial advice. Always manage risk appropriately and never risk more than you can afford to lose.
Chart: RIOT Monthly — NASDAQ | September 1, 2026






Leave a Comment